Inhabitants per dentist – year 2023
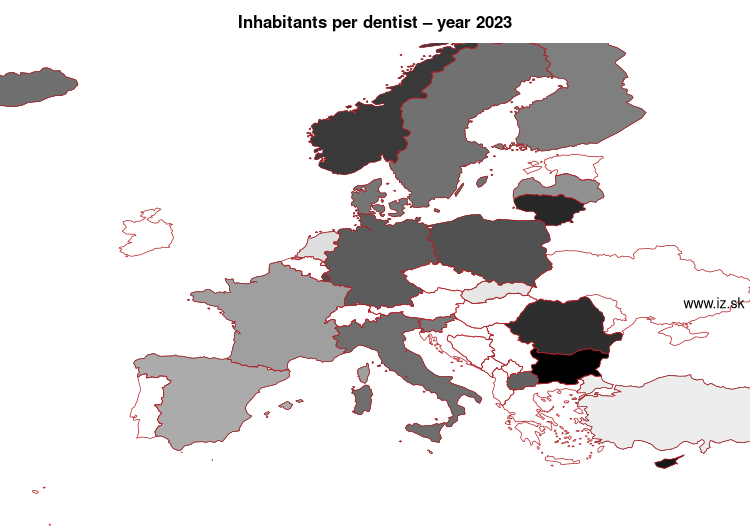
| Order | Code | Region | Value | Note |
|---|---|---|---|---|
| 1. | Bulgaria | BG | 636,34 | period 2024 |
| 2. | Liechtenstein | LI | 687 | |
| 3. | Cyprus | CY | 756,5 | |
| 4. | Lithuania | LT | 841,12 | |
| 5. | Romania | RO | 874,84 | |
| 6. | Norway | NO | 929,7 | |
| 7. | Luxembourg | LU | 1033,49 | period 2017 |
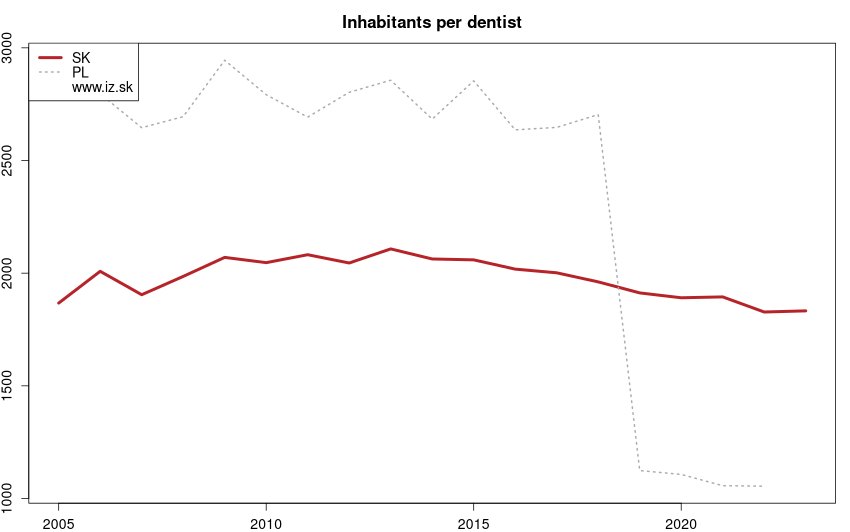
| 8. | Poland | PL | 1054,73 | period 2022 |
| 9. | Germany | DE | 1114,12 | |
| 10. | North Macedonia | MK | 1141,41 | period 2021 |
| 11. | Italy | IT | 1208,47 | |
| 12. | Iceland | IS | 1217,67 | period 2024 |
| 13. | Sweden | SE | 1220,55 | period 2022 |
| 14. | Denmark | DK | 1247,26 | |
| 15. | Slovenia | SI | 1263,68 | |
| 16. | Finland | FI | 1295,57 | |
| 17. | Latvia | LV | 1386,59 | |
| 18. | France | FR | 1460,79 | |
| 19. | Spain | ES | 1522,1 | |
| 20. | Netherlands | NL | 1786,27 | period 2016 |
| 21. | Slovakia | SK | 1832,74 | |
| 22. | Turkey | TR | 1866,35 | |
| 23. | Malta | MT | 1960,1 | |
| 24. | Montenegro | ME | 2508,8 | period 2007 |
| 25. | Serbia | RS | 3795,52 |
Data for the period year 2023. Source of the data is Eurostat, table [hlth_rs_prs2].
See also:
Suggested citation: Michal Páleník: 30 graphs on ageing - Inhabitants per dentist – year 2023, IZ Bratislava, retrieved from: https://www.iz.sk/30-graphs-on-ageing/inhabitants-per-dentist, doi:10.5281/zenodo.6079128
https://www.iz.sk/30-graphs-on-ageing/inhabitants-per-dentist

 Share
Share Facebook
 Twitter
 News
News