Netherlands – NL
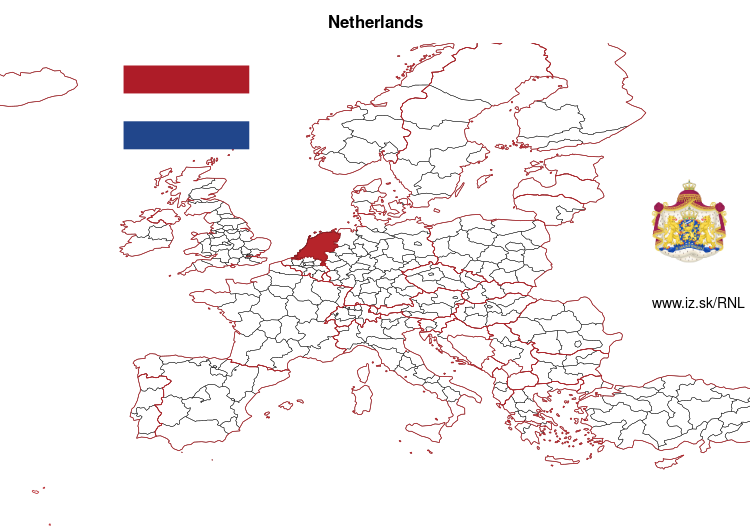
Netherlands slovensky: NL
Subregions: Northern Netherlands, Eastern Netherlands, Western Netherlands, Southern Netherlands
Unemployment
| Indicator | Period | Value |
|---|---|---|
| Unemployment | ||
| unemployment rate | 2025q4 | 3.9 |
| youth unemployment rate | 2025q4 | 8.6 |
| unemployment rate of low educated people | 2025q4 | 6.3 |
| Long term unemployment | ||
| long term unemployment | 2025q4 | 0.5 |
| share of long term unemployed | 2025 | 13.7 |
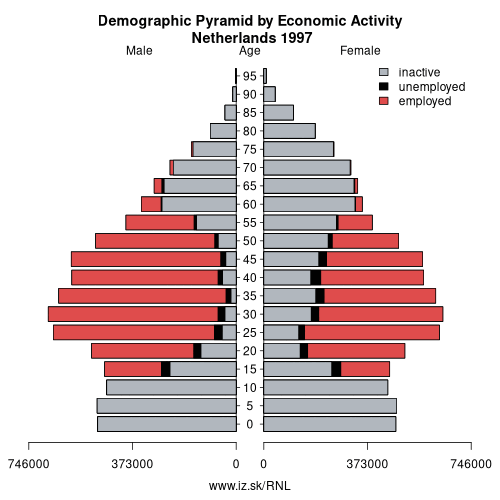
Composition of population according to age group, education and economic activity, Netherlands
| Age group | Low education | Middle education | High education |
|---|---|---|---|
| Y20-29 | P: 285.6 E: 201.3; U: 18.9; I: 65.4 | P: 1100.5 E: 917.5; U: 51.8; I: 131.2 | P: 936.8 E: 830.5; U: 42.0; I: 64.3 |
| Y30-39 | P: 303.9 E: 213.7; U: 12.3; I: 77.9 | P: 777.5 E: 678.5; U: 18.0; I: 81.0 | P: 1234.3 E: 1143.7; U: 27.7; I: 62.9 |
| Y40-49 | P: 372.2 E: 269.5; U: 9.1; I: 93.6 | P: 729.5 E: 635.5; U: 14.3; I: 79.7 | P: 984.6 E: 907.8; U: 17.6; I: 59.2 |
| Y50-59 | P: 594.9 E: 422.5; U: 9.8; I: 162.6 | P: 959.2 E: 818.8; U: 13.0; I: 127.4 | P: 893.8 E: 807.6; U: 15.4; I: 70.8 |
| Y60-69 | P: 754.6 E: 329.2; U: 6.7; I: 418.7 | P: 814.4 E: 414.7; U: 11.2; I: 388.5 | P: 659.1 E: 368.2; U: 12.9; I: 278.0 |
Note: in thousands in 2024, according to labour force sample survey. P – total population, E – employed, U – unemployed, I – number of economically inactive
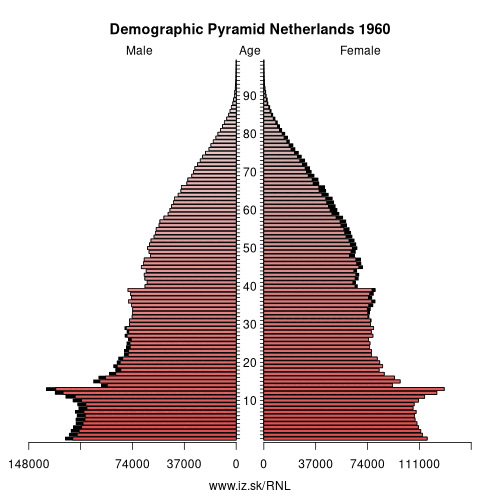
Demographics
| Indicator | Period | Value |
|---|---|---|
| Demographics | ||
| number of inhabitants | 2025 | 18 044 028 |
| population density | 2024 | 529.5 |
| old-age dependency ratio | 2025 | 32.4 |
| Population ageing | ||
| unemployment rate – over 55 years | 2025q4 | 2.6 |
| aggregate replacement ratio | 2025 | 0.56 |
| aggregate replacement ratio – females | 2025 | 0.63 |
| life expectancy of a 50 year old | 2023 | 33.3 |
| healty life expectancy at 50 years | 2023 | 17.6 |
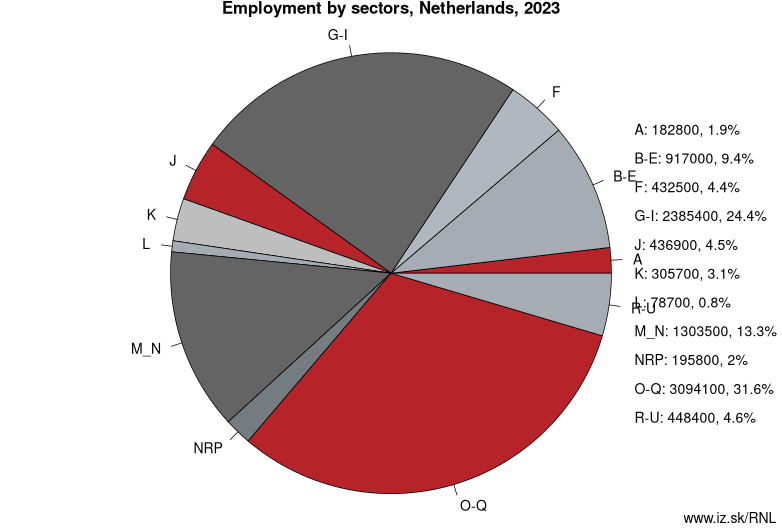
Employment by sectors, Netherlands
| NACE r2 | % | NACE r2 | % | ||
|---|---|---|---|---|---|
| A | 161.6 | 2% | B-E | 905.7 | 9% |
| F | 452.4 | 5% | G-I | 2363.1 | 24% |
| J | 437.6 | 4% | K | 266.9 | 3% |
| L | 82.4 | 1% | M_N | 1342.2 | 14% |
| NRP | 206.2 | 2% | O-Q | 3217.4 | 33% |
| R-U | 463.5 | 5% | TOTAL | 9899 | 100% |
Data for the period year 2025. Source of the data is Eurostat, table [lfst_r_lfe2en2].
From Wikipedia :
The Netherlands (Dutch: Nederland, [ˈneːdərlɑnt] (listen)) is a country located in Northwestern Europe with some overseas territories. In Europe, it consists of twelve provinces that border Germany to the east, Belgium to the south, and the North Sea to the northwest, with maritime borders in the North Sea with Belgium, Germany and the United Kingdom. Together with three island territories in the Caribbean Sea—Bonaire, Sint Eustatius and Saba—it forms a constituent country of the Kingdom of the Netherlands. The official language is Dutch, but a secondary official language in the province of Friesland is West Frisian.
The five largest cities in the Netherlands are Amsterdam, Rotterdam, The Hague, Utrecht, and Eindhoven. Amsterdam is the country's capital, while The Hague holds the seat of the States General, Cabinet and Supreme Court. The Port of Rotterdam is the largest port in Europe, and the largest in any country outside Asia. The country is a founding member of the EU, Eurozone, G10, NATO, OECD and WTO, as well as a part of the Schengen Area and the trilateral Benelux Union. It hosts several intergovernmental organisations and international courts, many of which are centered in The Hague, which is consequently dubbed 'the world's legal capital'.
Netherlands literally means 'lower countries' in reference to its low elevation and flat topography, with only about 50 % of its land exceeding 1 metre (3 ft 3 in) above sea level, and nearly 17 % falling below sea level. Most of the areas below sea level, known as polders, are the result of land reclamation that began in the 16th century.Other: Norway, Netherlands
Subregions: Northern Netherlands, Eastern Netherlands, Western Netherlands, Southern Netherlands
Suggested citation: Michal Páleník: Europe and its regions in numbers - Netherlands – NL, IZ Bratislava, retrieved from: https://www.iz.sk/PNL, ISBN: 978-80-970204-9-1, DOI:10.5281/zenodo.10200164
 Share
Share Facebook
 Twitter
 News
News