Belgium – BE
Belgium slovensky: BE
Subregions: Brussels-Capital Region, Flemish Region, Wallonia
Unemployment
| Indicator | Period | Value |
|---|---|---|
| Unemployment | ||
| unemployment rate | 2025 | 6.2 |
| youth unemployment rate | 2025 | 17.4 |
| unemployment rate of low educated people | 2025q4 | 14.7 |
| Long term unemployment | ||
| long term unemployment | 2025 | 2 |
| share of long term unemployed | 2025 | 31.6 |
Composition of population according to age group, education and economic activity, Belgium
| Age group | Low education | Middle education | High education |
|---|---|---|---|
| Y20-29 | P: 166.8 E: 68.8; U: 23.1; I: 74.9 | P: 720.0 E: 382.7; U: 52.3; I: 285.0 | P: 517.6 E: 385.1; U: 28.7; I: 103.8 |
| Y30-39 | P: 224.0 E: 121.7; U: 18.5; I: 83.8 | P: 555.2 E: 446.7; U: 32.2; I: 76.3 | P: 762.5 E: 706.4; U: 18.5; I: 37.6 |
| Y40-49 | P: 233.7 E: 133.6; U: 15.2; I: 84.9 | P: 545.2 E: 449.0; U: 20.6; I: 75.6 | P: 731.9 E: 669.2; U: 16.7; I: 46.0 |
| Y50-59 | P: 291.8 E: 158.8; U: 11.0; I: 122.0 | P: 628.5 E: 476.2; U: 17.4; I: 134.9 | P: 631.8 E: 566.6; U: 12.1; I: 53.1 |
| Y60-69 | P: 437.3 E: 62.7; U: 3.6; I: 371.0 | P: 552.0 E: 134.8; U: 5.5; I: 411.7 | P: 447.8 E: 191.9; U: 4.4; I: 251.5 |
Note: in thousands in 2024, according to labour force sample survey. P – total population, E – employed, U – unemployed, I – number of economically inactive
Demographics
| Indicator | Period | Value |
|---|---|---|
| Demographics | ||
| number of inhabitants | 2025 | 11 883 495 |
| population density | 2024 | 389.1 |
| old-age dependency ratio | 2025 | 31.8 |
| Population ageing | ||
| unemployment rate – over 55 years | 2025q4 | 3.6 |
| aggregate replacement ratio | 2025 | 0.48 |
| aggregate replacement ratio – females | 2025 | 0.5 |
| life expectancy of a 50 year old | 2023 | 33.9 |
| healty life expectancy at 50 years | 2023 | 20.8 |
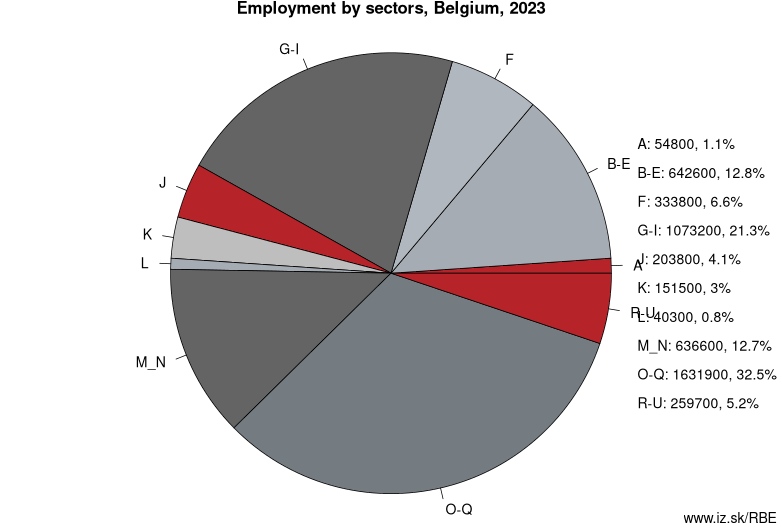
Employment by sectors, Belgium
| NACE r2 | % | NACE r2 | % | ||
|---|---|---|---|---|---|
| A | 44.5 | 1% | B-E | 654.5 | 13% |
| F | 322.4 | 6% | G-I | 1070.5 | 21% |
| J | 219.8 | 4% | K | 156.3 | 3% |
| L | 31.9 | 1% | M_N | 631.4 | 12% |
| O-Q | 1728 | 34% | R-U | 287.4 | 6% |
| TOTAL | 5146.6 | 100% |
Data for the period year 2025. Source of the data is Eurostat, table [lfst_r_lfe2en2].
From Wikipedia : Belgium, officially the Kingdom of Belgium, is a sovereign state in Western Europe. It is bordered by the Netherlands to the north, Germany to the east, Luxembourg to the southeast, France to the southwest, and the North Sea to the northwest. It covers an area of 30,688 km2 (11,849 sq mi) and has a population of more than 11.4 million. The capital and largest city is Brussels; other major cities are Antwerp, Ghent, Charleroi and Liège.
Belgium is a federal constitutional monarchy with a parliamentary system. Its institutional organization is complex and is structured on both regional and linguistic grounds. It is divided into three highly autonomous regions: Flanders in the north, Wallonia in the south, and the Brussels-Capital Region. Brussels is the smallest and most densely populated region, as well as the richest region in terms of GDP per capita.
Belgium is home to two main linguistic groups or communities: the Dutch-speaking, mostly Flemish Community, which constitutes about 59 percent of the population, and the French-speaking Community, which comprises about 40 percent of all Belgians. A small German-speaking Community, numbering around one percent, exists in the East Cantons.
Neighbours: France, Netherlands, Germany, Luxembourg
Subregions: Brussels-Capital Region, Flemish Region, Wallonia
Suggested citation: Michal Páleník: Europe and its regions in numbers - Belgium – BE, IZ Bratislava, retrieved from: https://www.iz.sk/PBE, ISBN: 978-80-970204-9-1, DOI:10.5281/zenodo.10200164
 Share
Share Facebook
 Twitter
 News
News