Wallonia – BE3
EU regions: Belgium > Wallonia
| Indicator | Period | Value |
|---|---|---|
| Life long learning | ||
| life long learning participation | 2025 | 14.5 |
| Part time jobs and flexible employment | ||
| percentage of part time workers | 2025 | 23.66 |
| percentage of part time workers, men | 2025 | 11.97 |
| percentage of part time workers, women | 2025 | 36.85 |
| Gender differences | ||
| gender gap in employment rate | 2025 | 89.51 |
| gender gap in unemployment rate | 2025 | 98.72 |
| Graduates and young people | ||
| unemployment rate of youth with elementary education | 2025 | 34.4 |
| NEET | 2025 | 9.5 |
| Gross domestic product | ||
| GDP per capita in PPS of EU average | 2024 | 87 |
| Employment | ||
| employment rate | 2025 | 62.4 |
| Social exclusion | ||
| people at risk of poverty or social exclusion | 2020 | 24.6 |
Wallonia slovensky: BE3
Subregions: Walloon Brabant, Hainaut, Province of Liege, Luxembourg, Province of Namur
Unemployment
| Indicator | Period | Value |
|---|---|---|
| Unemployment | ||
| unemployment rate | 2025 | 7.9 |
| youth unemployment rate | 2025 | 22.2 |
| Long term unemployment | ||
| long term unemployment | 2025 | 2.9 |
| share of long term unemployed | 2025 | 37 |
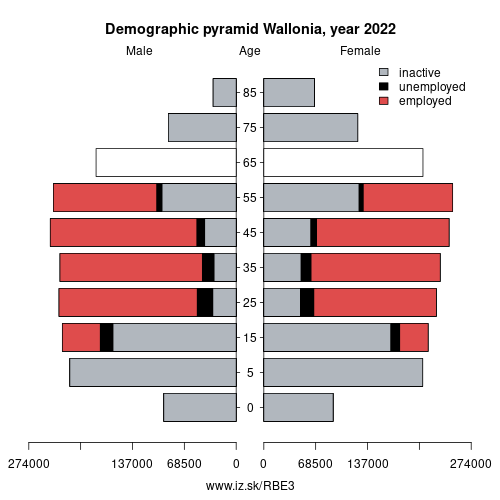
Demographics
| Indicator | Period | Value |
|---|---|---|
| Demographics | ||
| number of inhabitants | 2025 | 3 727 515 |
| population density | 2024 | 220.7 |
| old-age dependency ratio | 2025 | 31.5 |
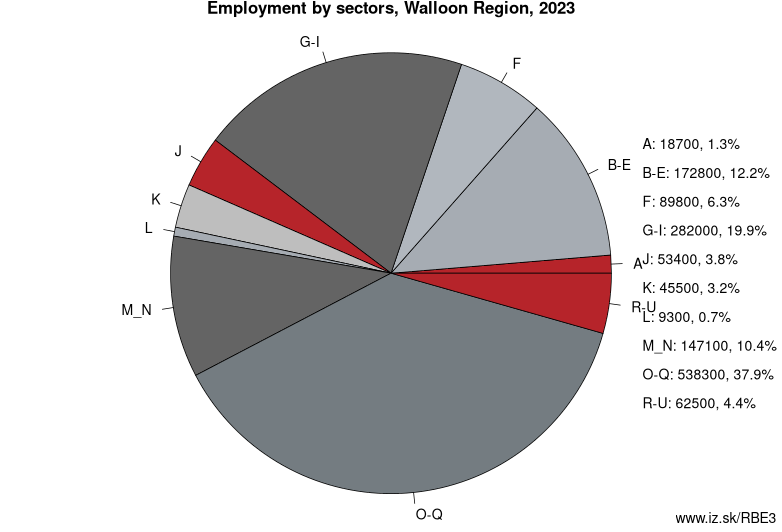
Employment by sectors, Wallonia
| NACE r2 | % | NACE r2 | % | ||
|---|---|---|---|---|---|
| A | 14.8 | 1% | B-E | 175 | 12% |
| F | 88 | 6% | G-I | 295.8 | 20% |
| J | 46.3 | 3% | K | 47.4 | 3% |
| L | 9.5 | 1% | M_N | 155.4 | 10% |
| O-Q | 580.7 | 39% | R-U | 76.2 | 5% |
| TOTAL | 1489.1 | 100% |
Data for the period year 2025. Source of the data is Eurostat, table [lfst_r_lfe2en2].
From Wikipedia : Wallonia (; French: Wallonie [walɔni]; German: Wallonien [vaˈloːni̯ən] (listen) or Wallonie [valoˈniː]; Dutch: Wallonië [ʋɑˈloːnijə] (listen); Walloon: Walonreye [walɔnʀɛj]; Luxembourgish: Wallounien [vɑˈləʊ̯niə̯n]) is a region of Belgium. As the southern portion of the country, Wallonia is primarily French-speaking, and accounts for 55 % of Belgium's territory, but only a third of its population. The Walloon Region was not merged with the French Community of Belgium, which is the political entity responsible for matters related mainly to culture and education, because the French Community of Belgium encompasses both Wallonia and the majority French-Speaking Brussels-Capital Region.
The German-speaking minority in eastern Wallonia results from World War I and the subsequent annexation of three cantons that were initially part of the former German empire. This community represents less than 1 % of the Belgian population. It forms the German-speaking Community of Belgium, which has its own government and parliament for culture-related issues.
During the industrial revolution, Wallonia was second only to the United Kingdom in industrialization, capitalizing on its extensive deposits of coal and iron. This brought the region wealth, and from the beginning of the 19th to the middle of the 20th century, Wallonia was the more prosperous half of Belgium. Since World War II, the importance of heavy industry has greatly diminished, and the Flemish Region surpassed Wallonia in wealth, as Wallonia declined economically. Wallonia now suffers from high unemployment and has a significantly lower GDP per capita than Flanders.
Other: Belgium, Brussels-Capital Region, Wallonia, Flemish Region
Neighbours: Flemish Region, Grand Est, Hauts-de-France, Southern Netherlands, North Rhine-Westphalia, Luxembourg, Rhineland-Palatinate
Subregions: Walloon Brabant, Hainaut, Province of Liege, Luxembourg, Province of Namur
Suggested citation: Michal Páleník: Europe and its regions in numbers - Wallonia – BE3, IZ Bratislava, retrieved from: https://www.iz.sk/PBE3, ISBN: 978-80-970204-9-1, DOI:10.5281/zenodo.10200164
 Share
Share Facebook
 Twitter
 News
News