IZ Bratislava : Regularly updated : EU indicators : Number of inhabitants : Number of inhabitants NUTS 1 :
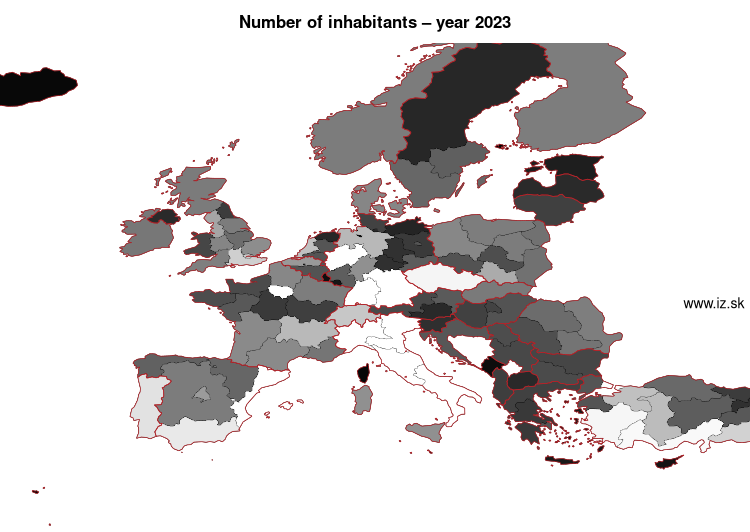
Number of inhabitants NUTS 1 – year 2025
| Order | Code | Region | Value | Note |
|---|---|---|---|---|
| 1. | Åland | FI2 | 30 654 | |
| 2. | Liechtenstein | LI0 | 40 886 | |
| 3. | Azores (NUTS 1) | PT2 | 241 718 | |
| 4. | Madeira (NUTS 1) | PT3 | 259 440 | |
| 5. | Corsica | FRM | 362 253 | |
| 6. | Iceland | IS0 | 389 444 | |
| 7. | Malta | MT0 | 574 250 | |
| 8. | Montenegro | ME0 | 623 327 | |
| 9. | Luxembourg | LU0 | 681 973 | |
| 10. | Bremen | DE5 | 704 881 | |
| 11. | Cyprus | CY0 | 982 966 | |
| 12. | Saarland | DEC | 1 012 141 | |
| 13. | Aegean Islands and Crete | EL4 | 1 156 084 | |
| 14. | Brussels-Capital Region | BE1 | 1 271 709 | |
| 15. | Estonia | EE0 | 1 369 995 | |
| 16. | Mecklenburg-Vorpommern | DE8 | 1 573 597 | |
| 17. | Northern Sweden | SE3 | 1 758 543 | |
| 18. | Northern Netherlands | NL1 | 1 773 584 | |
| 19. | North Macedonia | MK0 | 1 822 612 | |
| 20. | Southern Austria | AT2 | 1 841 811 | |
| 21. | Latvia | LV0 | 1 860 565 | |
| 22. | Hamburg | DE6 | 1 862 565 | |
| 23. | Northern Ireland | UKN | 1 875 957 | period 2018 |
| 24. | Thuringia | DEG | 2 100 277 | |
| 25. | Slovenia | SI0 | 2 130 850 | |
| 26. | Saxony-Anhalt | DEE | 2 135 597 | |
| 27. | Northeast Anatolia Region (statistical) | TRA | 2 140 232 | |
| 28. | Canary Islands | ES7 | 2 258 866 | |
| 29. | overseas department and region of France | FRY | 2 304 053 | |
| 30. | Albania | AL0 | 2 363 314 | |
| 31. | Central Greece | EL6 | 2 546 748 | |
| 32. | Brandenburg | DE4 | 2 556 747 | |
| 33. | Centre-Val de Loire | FRB | 2 588 306 | |
| 34. | North East England | UKC | 2 656 980 | period 2019 |
| 35. | East Black Sea Region (statistical) | TR9 | 2 707 777 | |
| 36. | Bourgogne-Franche-Comté | FRC | 2 796 878 | |
| 37. | Transdanubia | HU2 | 2 871 756 | |
| 38. | Lithuania | LT0 | 2 890 664 | |
| 39. | Northern Greece | EL5 | 2 905 231 | |
| 40. | Schleswig-Holstein | DEF | 2 959 517 | |
| 41. | Central Hungary | HU1 | 3 021 343 | |
| 42. | Northern and Eastern Bulgaria | BG3 | 3 107 886 | |
| 43. | Wales | UKL | 3 136 383 | period 2019 |
| 44. | Serbia-South | RS2 | 3 165 341 | |
| 45. | Western Austria | AT3 | 3 297 809 | |
| 46. | South-Western and South-Central Bulgaria | BG4 | 3 329 474 | |
| 47. | Normandy | FRD | 3 350 982 | |
| 48. | Serbia-North | RS1 | 3 402 442 | |
| 49. | MAKROREGION CENTRALNY | PL7 | 3 425 297 | |
| 50. | Brittany | FRH | 3 489 252 | |
| 51. | Macroregiunea Patru | RO4 | 3 519 058 | |
| 52. | Great Plain and North | HU3 | 3 646 403 | |
| 53. | MAKROREGION POŁUDNIOWO-ZACHODNI | PL5 | 3 683 074 | |
| 54. | Berlin | DE3 | 3 685 265 | |
| 55. | Wallonia | BE3 | 3 727 515 | |
| 56. | Attica Region | EL3 | 3 764 272 | |
| 57. | Southern Netherlands | NL4 | 3 799 375 | |
| 58. | Eastern Netherlands | NL2 | 3 813 542 | |
| 59. | West Marmara Region | TR2 | 3 832 502 | |
| 60. | HRVATSKA | HR0 | 3 874 350 | |
| 61. | Central East Anatolia Region (statistical) | TRB | 3 876 707 | |
| 62. | Pays de la Loire | FRG | 3 945 359 | |
| 63. | Saxony | DED | 4 042 422 | |
| 64. | East Austria | AT1 | 4 057 593 | |
| 65. | Rhineland-Palatinate | DEB | 4 129 569 | |
| 66. | Central Anatolia Region (statistical) | TR7 | 4 160 359 | |
| 67. | East Sweden | SE1 | 4 244 740 | |
| 68. | Noroeste | ES1 | 4 323 492 | |
| 69. | Southern Sweden | SE2 | 4 584 427 | |
| 70. | Noreste | ES2 | 4 617 621 | |
| 71. | West Black Sea Region (statistical) | TR8 | 4 711 687 | |
| 72. | East Midlands | UKF | 4 811 065 | period 2019 |
| 73. | Macroregiunea Unu | RO1 | 4 835 561 | |
| 74. | East Macroregion | PL8 | 4 941 317 | |
| 75. | Macroregiunea Trei | RO3 | 5 139 149 | |
| 76. | Provence-Alpes-Côte d'Azur | FRL | 5 285 125 | |
| 77. | Slovakia | SK0 | 5 419 451 | |
| 78. | Ireland | IE0 | 5 440 278 | |
| 79. | Scotland | UKM | 5 454 238 | period 2019 |
| 80. | MAKROREGION WOJEWÓDZTWO MAZOWIECKIE | PL9 | 5 484 110 | |
| 81. | Yorkshire and the Humber | UKE | 5 486 230 | period 2019 |
| 82. | Makroregion północny | PL6 | 5 504 196 | |
| 83. | Macroregiunea Doi | RO2 | 5 549 383 | |
| 84. | Grand Est | FRF | 5 550 155 | |
| 85. | Centro | ES4 | 5 580 944 | |
| 86. | Norway | NO0 | 5 594 340 | |
| 87. | Mainland Finland | FI1 | 5 605 317 | |
| 88. | South West England | UKK | 5 616 381 | period 2019 |
| 89. | West Midlands | UKG | 5 907 872 | period 2019 |
| 90. | MAKROREGION PÓŁNOCNO-ZACHODNI | PL4 | 5 949 043 | |
| 91. | Hauts-de-France | FRE | 5 974 447 | |
| 92. | Denmark | DK0 | 5 992 734 | |
| 93. | Occitania | FRJ | 6 205 575 | |
| 94. | Nouvelle-Aquitaine | FRI | 6 210 839 | |
| 95. | East of England | UKH | 6 235 410 | period 2019 |
| 96. | Hesse | DE7 | 6 280 793 | |
| 97. | Insular Italy | ITG | 6 349 771 | |
| 98. | Flemish Region | BE2 | 6 884 271 | |
| 99. | Community of Madrid | ES3 | 7 113 886 | |
| 100. | North West England | UKD | 7 300 075 | period 2019 |
| 101. | MAKROREGION POŁUDNIOWY | PL2 | 7 510 458 | |
| 102. | Lower Saxony | DE9 | 8 004 489 | |
| 103. | Auvergne-Rhône-Alpes | FRK | 8 270 088 | |
| 104. | West Anatolia Region (statistical) | TR5 | 8 456 864 | |
| 105. | Western Netherlands | NL3 | 8 657 526 | |
| 106. | East Marmara Region (statistical) | TR4 | 8 676 119 | |
| 107. | Greater London | UKI | 8 982 256 | period 2019 |
| 108. | SCHWEIZ/SUISSE/SVIZZERA | CH0 | 9 051 029 | |
| 109. | South East England | UKJ | 9 175 033 | period 2019 |
| 110. | Southeast Anatolia Region (statistical) | TRC | 9 490 286 | |
| 111. | Continental Portugal | PT1 | 10 248 477 | |
| 112. | Sur | ES6 | 10 434 336 | |
| 113. | Czech Republic | CZ0 | 10 909 500 | |
| 114. | Mediterranean Region (statistical) | TR6 | 10 936 452 | |
| 115. | Aegean Region (statistical) | TR3 | 10 974 357 | |
| 116. | Baden-Württemberg | DE1 | 11 245 898 | |
| 117. | Northeast Italy | ITH | 11 595 006 | |
| 118. | Central Italy | ITI | 11 698 912 | |
| 119. | Île-de-France | FR1 | 12 549 288 | |
| 120. | Bavaria | DE2 | 13 248 928 | |
| 121. | South Italy | ITF | 13 381 314 | |
| 122. | Este | ES5 | 14 799 152 | |
| 123. | Istanbul Province | TR1 | 15 701 602 | |
| 124. | Northwest Italy | ITC | 15 918 461 | |
| 125. | North Rhine-Westphalia | DEA | 18 034 454 |
Data for the period year 2025. Source of the data is Eurostat, table [demo_r_d2jan].
See also:
Suggested citation: Michal Páleník: Europe and its regions in numbers - Number of inhabitants NUTS 1 – year 2025, IZ Bratislava, retrieved from: https://www.iz.sk/en/projects/EU-indicators/number-of-inhabitants-nuts-1, ISBN: 978-80-970204-9-1, DOI:10.5281/zenodo.10200164
https://www.iz.sk/en/projects/EU-indicators/number-of-inhabitants-nuts-1
Similar articles
Demographic development in Slovakia, Demographic pyramid by economic activity, Twentythird seminar on labour economics, Old-age dependency ratio – year 2025, Number of inhabitants NUTS 3 – year 2025, Population density – year 2024, Old-age dependency ratio NUTS 1 – year 2025, Number of inhabitants NUTS 2 – year 2025
 Share
Share Facebook
 Twitter
 News
News