Bremen – DE5
| Indicator | Period | Value |
|---|---|---|
| Life long learning | ||
| life long learning participation | 2025 | 11 |
| Part time jobs and flexible employment | ||
| percentage of part time workers | 2025 | 32.73 |
| percentage of part time workers, men | 2025 | 16.65 |
| percentage of part time workers, women | 2025 | 51.45 |
| Gender differences | ||
| gender gap in employment rate | 2025 | 89.01 |
| gender gap in unemployment rate | 2017 | 63.46 |
| Graduates and young people | ||
| NEET | 2019 | 9.3 |
| Gross domestic product | ||
| GDP per capita in PPS of EU average | 2024 | 132 |
| Employment | ||
| employment rate | 2025 | 71.4 |
Bremen slovensky: DE5
Subregions: Bremen, Bremen, Bremerhaven
Unemployment
| Indicator | Period | Value |
|---|---|---|
| Unemployment | ||
| unemployment rate | 2025 | 5.2 |
| youth unemployment rate | 2011 | 15.3 |
| Long term unemployment | ||
| long term unemployment | 2019 | 1.7 |
| share of long term unemployed | 2019 | 33.9 |
Demographics
| Indicator | Period | Value |
|---|---|---|
| Demographics | ||
| number of inhabitants | 2025 | 704 881 |
| population density | 2024 | 1799.9 |
| old-age dependency ratio | 2025 | 32.2 |
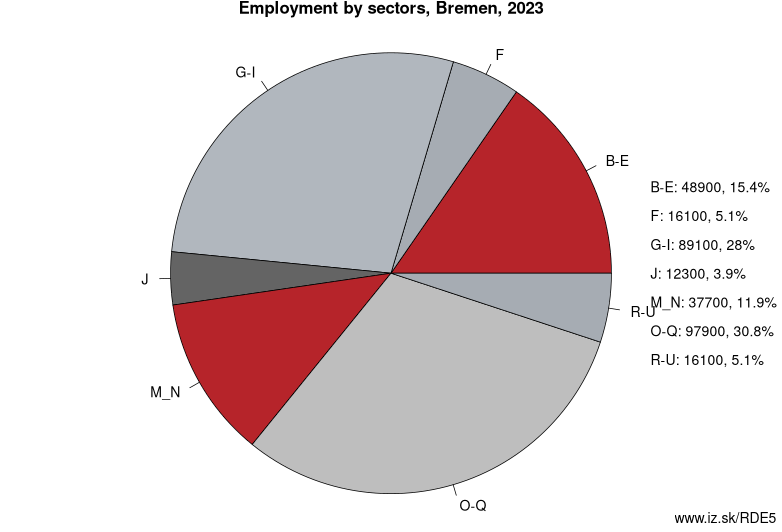
Employment by sectors, Bremen
| NACE r2 | % | NACE r2 | % | ||
|---|---|---|---|---|---|
| B-E | 52.7 | 16% | F | 17.4 | 5% |
| G-I | 81.8 | 24% | J | 13.9 | 4% |
| M_N | 38.6 | 11% | O-Q | 104.3 | 31% |
| R-U | 18.4 | 5% | TOTAL | 338.6 | 100% |
Data for the period year 2025. Source of the data is Eurostat, table [lfst_r_lfe2en2].
Other: Germany, Bremen, Saarland, Saxony, Saxony-Anhalt, Baden-Württemberg, Hamburg, Berlin, North Rhine-Westphalia, Hesse, Bavaria, Mecklenburg-Vorpommern, Schleswig-Holstein, Brandenburg, Rhineland-Palatinate, Thuringia, Lower Saxony
Neighbours: Lower Saxony
Subregions: Bremen, Bremen, Bremerhaven
Suggested citation: Michal Páleník: Europe and its regions in numbers - Bremen – DE5, IZ Bratislava, retrieved from: https://www.iz.sk/PDE5, ISBN: 978-80-970204-9-1, DOI:10.5281/zenodo.10200164
https://www.iz.sk/en/projects/eu-regions/DE5
 Share
Share Facebook
 Twitter
 News
News