IZ Bratislava : Regularly updated : EU indicators : GDP per capita in PPS of EU average : GDP per capita in PPS of EU average NUTS 1 :
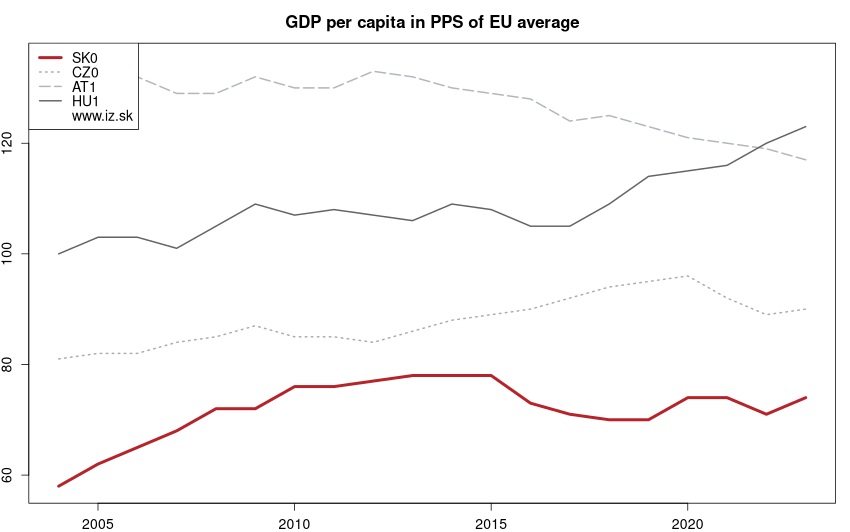
GDP per capita in PPS of EU average NUTS 1 – year 2024
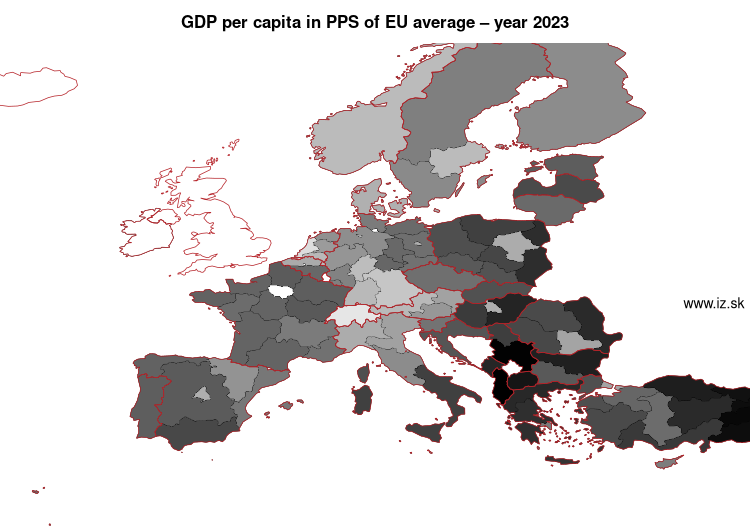
Data for the period year 2024. Source of the data is Eurostat, table [nama_10r_2gdp].
See also:
Suggested citation: Michal Páleník: Europe and its regions in numbers - GDP per capita in PPS of EU average NUTS 1 – year 2024, IZ Bratislava, retrieved from: https://www.iz.sk/en/projects/EU-indicators/gdp-per-capita-in-pps-of-eu-average-nuts-1, ISBN: 978-80-970204-9-1, DOI:10.5281/zenodo.10200164
https://www.iz.sk/en/projects/EU-indicators/gdp-per-capita-in-pps-of-eu-average-nuts-1
Similar articles
Basic indicators, GDP per capita in PPS of EU average – year 2025, GDP per capita in PPS of EU average NUTS 2 – year 2024, Share of salaries on GDP – 1 quarter 2026, HICP inflation – December 2025, Payable interest of public debt as % od GDP – year 2025, GDP per capita in PPS of EU average NUTS 3 – year 2023
 Share
Share Facebook
 Twitter
 News
News