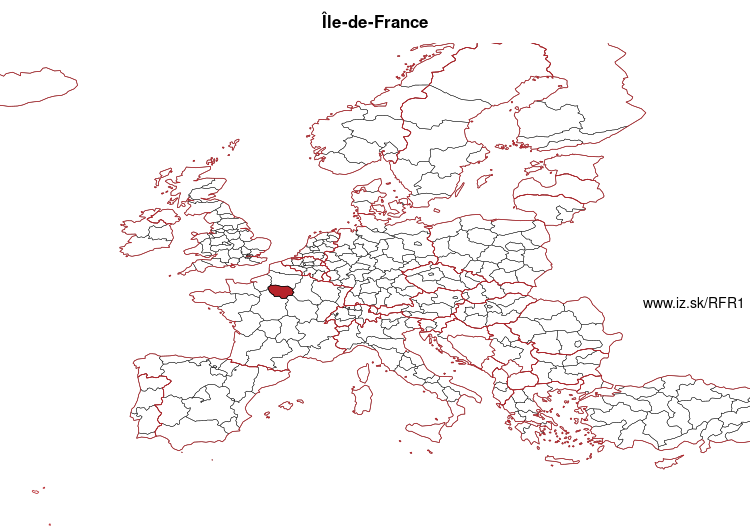
Île-de-France – FR1
EU regions: France > Île-de-France
| Indicator | Period | Value |
|---|---|---|
| Life long learning | ||
| life long learning participation | 2025 | 18 |
| Part time jobs and flexible employment | ||
| percentage of part time workers | 2025 | 13.89 |
| percentage of part time workers, men | 2025 | 8.01 |
| percentage of part time workers, women | 2025 | 19.96 |
| Gender differences | ||
| gender gap in employment rate | 2025 | 92.96 |
| gender gap in unemployment rate | 2025 | 98.88 |
| Graduates and young people | ||
| unemployment rate of youth with elementary education | 2025 | 39.4 |
| NEET | 2025 | 10.4 |
| Gross domestic product | ||
| GDP per capita in PPS of EU average | 2024 | 160 |
| Employment | ||
| employment rate | 2025 | 69.8 |
Île-de-France slovensky: FR1
Subregions: Île-de-France, Paris, Seine-et-Marne, Yvelines, Essonne, Hauts-de-Seine, Seine-Saint-Denis, Val-de-Marne, Val-d'Oise
Unemployment
| Indicator | Period | Value |
|---|---|---|
| Unemployment | ||
| unemployment rate | 2025 | 8.9 |
| youth unemployment rate | 2025 | 21.2 |
| Long term unemployment | ||
| long term unemployment | 2025 | 2.4 |
| share of long term unemployed | 2025 | 26.7 |
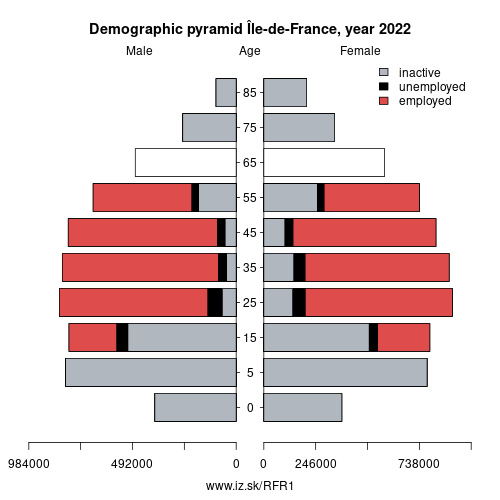
Demographics
| Indicator | Period | Value |
|---|---|---|
| Demographics | ||
| number of inhabitants | 2025 | 12 549 288 |
| population density | 2024 | 1048.2 |
| old-age dependency ratio | 2025 | 24.9 |
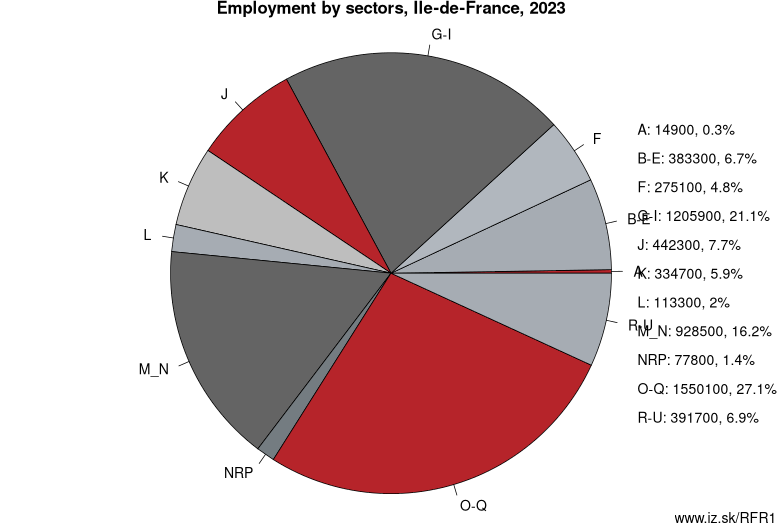
Employment by sectors, Île-de-France
| NACE r2 | % | NACE r2 | % | ||
|---|---|---|---|---|---|
| A | 15.4 | 0% | B-E | 424.3 | 7% |
| F | 297.8 | 5% | G-I | 1331.1 | 23% |
| J | 480.4 | 8% | K | 310.5 | 5% |
| L | 116.8 | 2% | M_N | 886.1 | 15% |
| NRP | 89.1 | 2% | O-Q | 1456.2 | 25% |
| R-U | 359.9 | 6% | TOTAL | 5767.6 | 100% |
Data for the period year 2025. Source of the data is Eurostat, table [lfst_r_lfe2en2].
Other: France, Île-de-France, Auvergne-Rhône-Alpes, Normandy, Occitania, Nouvelle-Aquitaine, Hauts-de-France, Pays de la Loire, overseas department and region of France, Bourgogne-Franche-Comté, Centre-Val de Loire, Grand Est, Brittany, Corsica, Provence-Alpes-Côte d'Azur
Neighbours: Centre-Val de Loire, Grand Est, Hauts-de-France, Normandy, Bourgogne-Franche-Comté
Subregions: Île-de-France, Paris, Seine-et-Marne, Yvelines, Essonne, Hauts-de-Seine, Seine-Saint-Denis, Val-de-Marne, Val-d'Oise
Suggested citation: Michal Páleník: Europe and its regions in numbers - Île-de-France – FR1, IZ Bratislava, retrieved from: https://www.iz.sk/PFR1, ISBN: 978-80-970204-9-1, DOI:10.5281/zenodo.10200164
 Share
Share Facebook
 Twitter
 News
News