- About us»
- Net income calculator»
- Population aging»
-
-
- Unemployment structure in the Visegrad region
- Development in least developed regions
- Statistics of the least developed regions in Slovakia
- Detailed statistics of least developed regions in Slovakia
-
- Average wage
- Material need benefits
- Meal allowance
- Counties of Slovakia
- Inflation
- Living and Subsistence Minimum
- Unemployment of Czechia and Slovakia
- NACE Classification
-
- Life expectancy
- Gender differences
- Youth unemployment and NEET
- Minimum wage in EU
- Unemployment rates of different age groups
- Share of salaries on GDP
- Unemployment rate
- Percentage of employees ususally working at nights
- Employment rate
- NEET
- Long term unemployment
-
- Bratislava and surroundings
- Kopanice
- Danube river
- lower Vah river
- middle Vár river
- upper Nitra river
- lower Nitra river
- Mining cities
- Kysuce a Orava
- upper Vah river - Liptov
- Spiš cities
- upper Hron river
- Juhoslovenská kotlina
- Košice fold and Torysa river
- upper Zemplín
- lower Zemplín
- EU regions
- NUTS3 regions of Slovakia
- LAU1 dataset
-
-
- Projects and activities
- Inclusive growth»
- Good work
- Project SKRS
- Social system – reality and vision
-
- Education of unemployed
- Young unemployed not taking part in education
- Proposal to change the system of education funding
- Library
- News»
- Contact
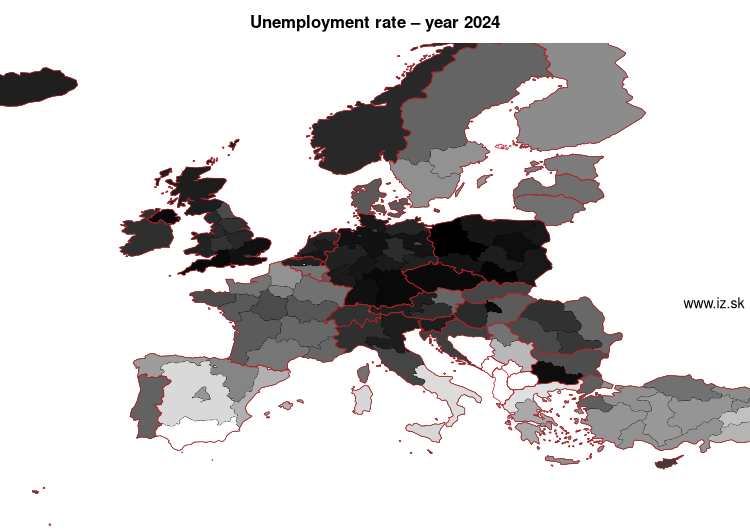
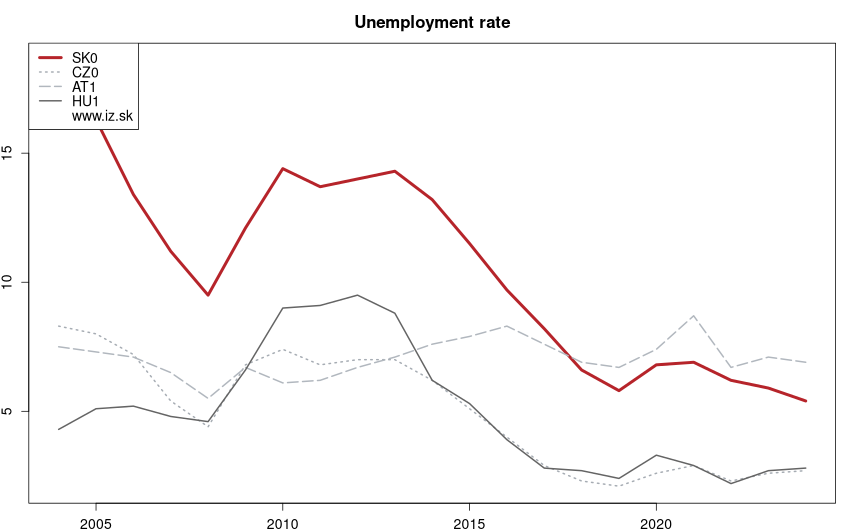
Unemployment rate NUTS 1 – year 2024

Data for the period year 2024. Source of the data is Eurostat, table [lfst_r_lfur2gan].

See also:
- EU labour market indicators
- Unemployment rates of different age groups
- Unemployment rates by duration
- Unemployment rates by duration
- ALMP expenditures vs. unemployment
- Vacancies and unemployment
Suggested citation: Michal Páleník: Europe and its regions in numbers - Unemployment rate NUTS 1 – year 2024, IZ Bratislava, retrieved from: https://www.iz.sk/en/projects/EU-indicators/unemployment-rate-nuts-1, ISBN: 978-80-970204-9-1, DOI:10.5281/zenodo.10200164
https://www.iz.sk/en/projects/EU-indicators/unemployment-rate-nuts-1
Similar articles
Unemployment rate NUTS 2 – year 2024, Unemployment rate NUTS 3 - year 2010

 Share
Share Facebook
 Twitter
 News
News