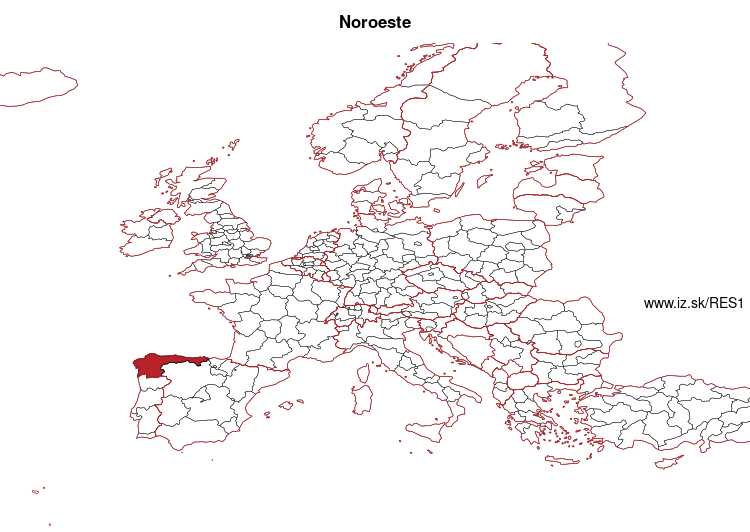
Noroeste – ES1
| Indicator | Period | Value |
|---|---|---|
| Life long learning | ||
| life long learning participation | 2025 | 15 |
| Part time jobs and flexible employment | ||
| percentage of part time workers | 2025 | 12.34 |
| percentage of part time workers, men | 2025 | 5.06 |
| percentage of part time workers, women | 2025 | 19.91 |
| Gender differences | ||
| gender gap in employment rate | 2025 | 93.69 |
| gender gap in unemployment rate | 2025 | 114.1 |
| Graduates and young people | ||
| unemployment rate of youth with elementary education | 2025 | 34.2 |
| NEET | 2025 | 9.1 |
| Gross domestic product | ||
| GDP per capita in PPS of EU average | 2024 | 84 |
| Employment | ||
| employment rate | 2025 | 67.5 |
| Social exclusion | ||
| people at risk of poverty or social exclusion | 2020 | 25.9 |
Noroeste slovensky: ES1
Subregions: Galicia, Asturias, Cantabria
Unemployment
| Indicator | Period | Value |
|---|---|---|
| Unemployment | ||
| unemployment rate | 2025 | 8.4 |
| youth unemployment rate | 2025 | 24.7 |
| Long term unemployment | ||
| long term unemployment | 2025 | 2.6 |
| share of long term unemployed | 2025 | 31.4 |
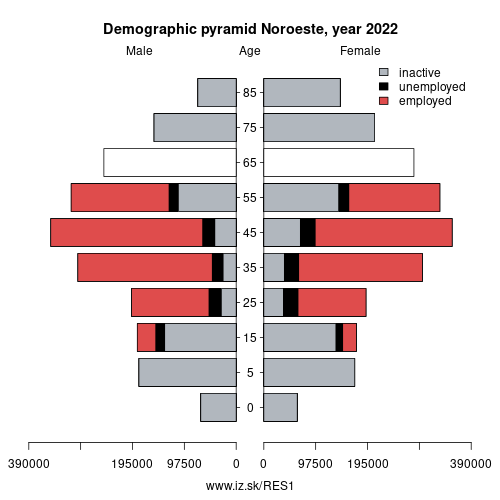
Demographics
| Indicator | Period | Value |
|---|---|---|
| Demographics | ||
| number of inhabitants | 2025 | 4 323 492 |
| population density | 2024 | 95.4 |
| old-age dependency ratio | 2025 | 43 |
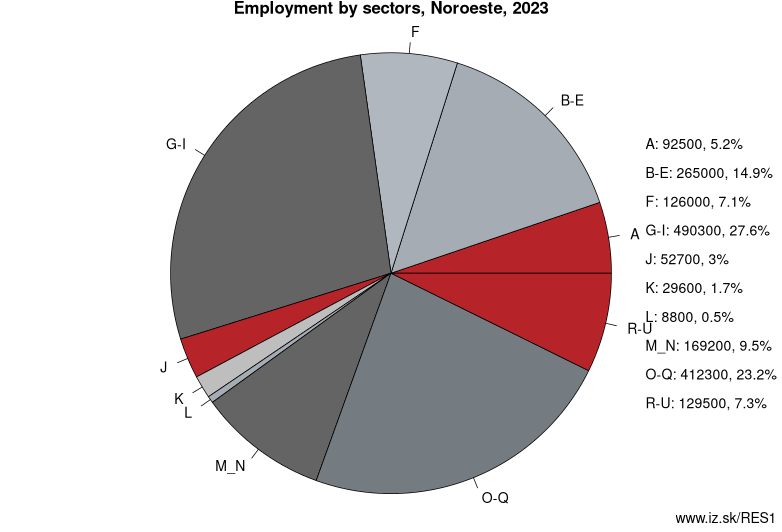
Employment by sectors, Noroeste
| NACE r2 | % | NACE r2 | % | ||
|---|---|---|---|---|---|
| A | 84 | 4% | B-E | 298.6 | 16% |
| F | 126.1 | 7% | G-I | 498.2 | 27% |
| J | 54 | 3% | K | 28.7 | 2% |
| L | 9.6 | 1% | M_N | 187 | 10% |
| O-Q | 455.3 | 24% | R-U | 127.7 | 7% |
| TOTAL | 1869.3 | 100% |
Data for the period year 2025. Source of the data is Eurostat, table [lfst_r_lfe2en2].
Other: Spain, Canary Islands, Sur, Centro, Este, Noreste, Noroeste, Community of Madrid
Neighbours: Noreste, Continental Portugal, Centro
Subregions: Galicia, Asturias, Cantabria
Suggested citation: Michal Páleník: Europe and its regions in numbers - Noroeste – ES1, IZ Bratislava, retrieved from: https://www.iz.sk/PES1, ISBN: 978-80-970204-9-1, DOI:10.5281/zenodo.10200164
https://www.iz.sk/en/projects/eu-regions/ES1
 Share
Share Facebook
 Twitter
 News
News