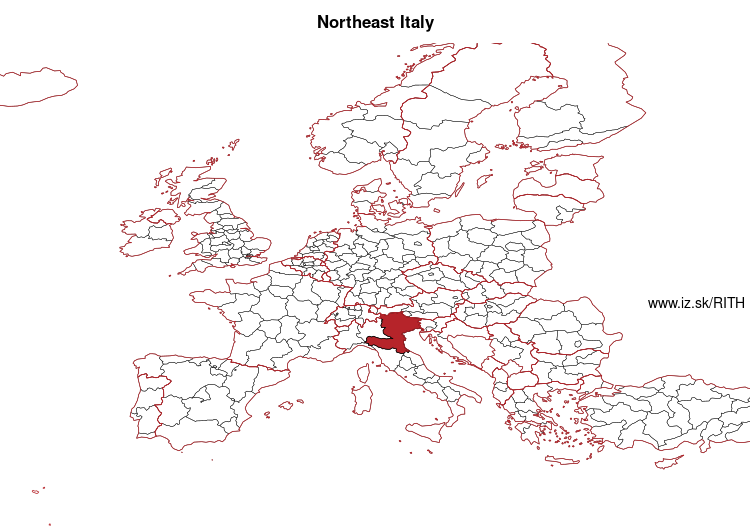
Northeast Italy – ITH
EU regions: Italy > Northeast Italy
| Indicator | Period | Value |
|---|---|---|
| Life long learning | ||
| life long learning participation | 2025 | 13.2 |
| Part time jobs and flexible employment | ||
| percentage of part time workers | 2025 | 16.57 |
| percentage of part time workers, men | 2025 | 5.18 |
| percentage of part time workers, women | 2025 | 30.82 |
| Gender differences | ||
| gender gap in employment rate | 2025 | 81.68 |
| gender gap in unemployment rate | 2025 | 167.86 |
| Graduates and young people | ||
| unemployment rate of youth with elementary education | 2025 | 16.9 |
| NEET | 2025 | 6.5 |
| Gross domestic product | ||
| GDP per capita in PPS of EU average | 2024 | 114 |
| Employment | ||
| employment rate | 2025 | 70.4 |
| Social exclusion | ||
| people at risk of poverty or social exclusion | 2020 | 13.2 |
Northeast Italy slovensky: ITH
Subregions: South Tyrol, Trentino-South Tyrol, Veneto, Friuli Venezia Giulia, Emilia-Romagna
Unemployment
| Indicator | Period | Value |
|---|---|---|
| Unemployment | ||
| unemployment rate | 2025 | 3.7 |
| youth unemployment rate | 2025 | 14.2 |
| Long term unemployment | ||
| long term unemployment | 2025 | 1.3 |
| share of long term unemployed | 2025 | 36.6 |
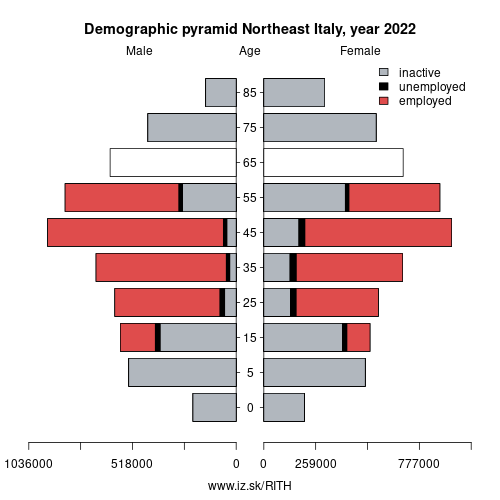
Demographics
| Indicator | Period | Value |
|---|---|---|
| Demographics | ||
| number of inhabitants | 2025 | 11 595 006 |
| population density | 2024 | 191.2 |
| old-age dependency ratio | 2025 | 39.5 |
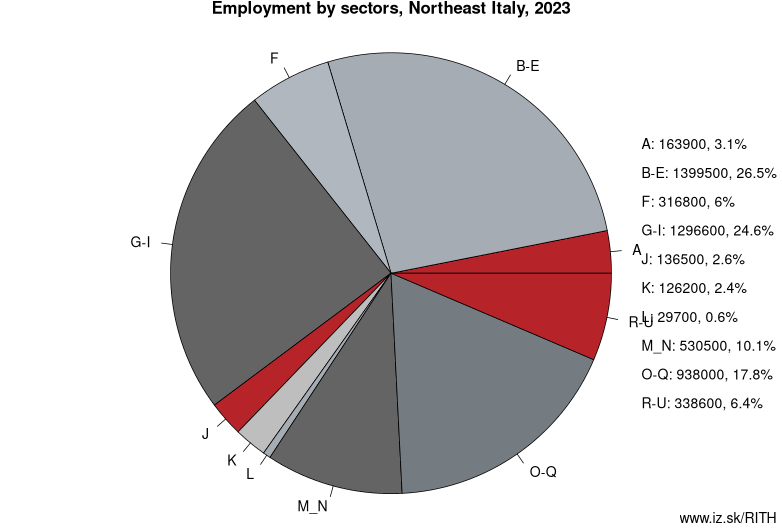
Employment by sectors, Northeast Italy
| NACE r2 | % | NACE r2 | % | ||
|---|---|---|---|---|---|
| A | 155 | 3% | B-E | 1369.8 | 26% |
| F | 336 | 6% | G-I | 1323.2 | 25% |
| J | 131.5 | 2% | K | 123.5 | 2% |
| L | 25 | 0% | M_N | 530.4 | 10% |
| O-Q | 1004.2 | 19% | R-U | 318 | 6% |
| TOTAL | 5316.7 | 100% |
Data for the period year 2025. Source of the data is Eurostat, table [lfst_r_lfe2en2].
Other: Italy, Northwest Italy, Northeast Italy, Insular Italy, Central Italy, South Italy
Neighbours: Slovenia, Northwest Italy, Central Italy, Western Austria, Southern Austria, SCHWEIZ/SUISSE/SVIZZERA
Subregions: South Tyrol, Trentino-South Tyrol, Veneto, Friuli Venezia Giulia, Emilia-Romagna
Suggested citation: Michal Páleník: Europe and its regions in numbers - Northeast Italy – ITH, IZ Bratislava, retrieved from: https://www.iz.sk/PITH, ISBN: 978-80-970204-9-1, DOI:10.5281/zenodo.10200164
https://www.iz.sk/en/projects/eu-regions/ITH
 Share
Share Facebook
 Twitter
 News
News