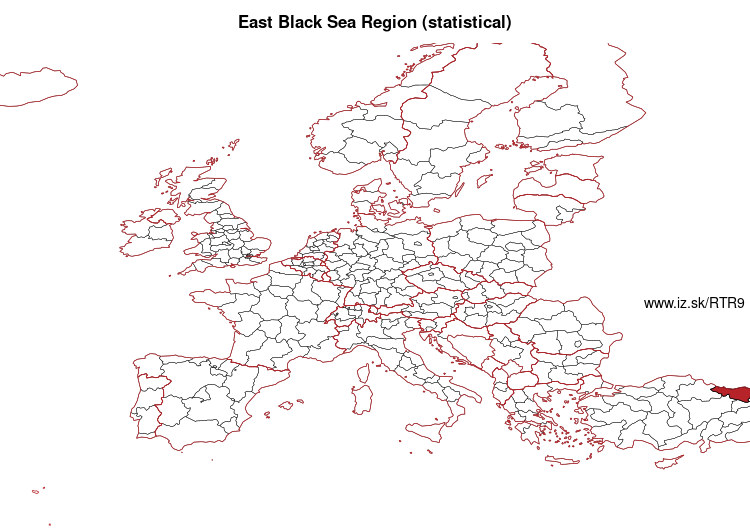
East Black Sea Region (statistical) – TR9
EU regions: Turkey > East Black Sea Region (statistical)
| Indicator | Period | Value |
|---|---|---|
| Life long learning | ||
| life long learning participation | 2025 | 6.6 |
| Part time jobs and flexible employment | ||
| percentage of part time workers | 2025 | 12.25 |
| percentage of part time workers, men | 2025 | 9.1 |
| percentage of part time workers, women | 2025 | 17.7 |
| Gender differences | ||
| gender gap in employment rate | 2025 | 58.86 |
| gender gap in unemployment rate | 2025 | 184.31 |
| Graduates and young people | ||
| unemployment rate of youth with elementary education | 2025 | 10.6 |
| NEET | 2025 | 19.5 |
| Gross domestic product | ||
| GDP per capita in PPS of EU average | 2024 | 45 |
| Employment | ||
| employment rate | 2025 | 58.4 |
East Black Sea Region (statistical) slovensky: TR9
Subregions: Trabzon Subregion, Trabzon Province, Ordu Province, Giresun Province, Rize Province, Artvin Province, Gümüşhane Province
Unemployment
| Indicator | Period | Value |
|---|---|---|
| Unemployment | ||
| unemployment rate | 2025 | 7.4 |
| youth unemployment rate | 2025 | 16.9 |
| Long term unemployment | ||
| long term unemployment | 2025 | 1.7 |
| share of long term unemployed | 2025 | 26 |
Demographics
| Indicator | Period | Value |
|---|---|---|
| Demographics | ||
| number of inhabitants | 2025 | 2 707 777 |
| population density | 2024 | 77.9 |
| old-age dependency ratio | 2025 | 24.4 |
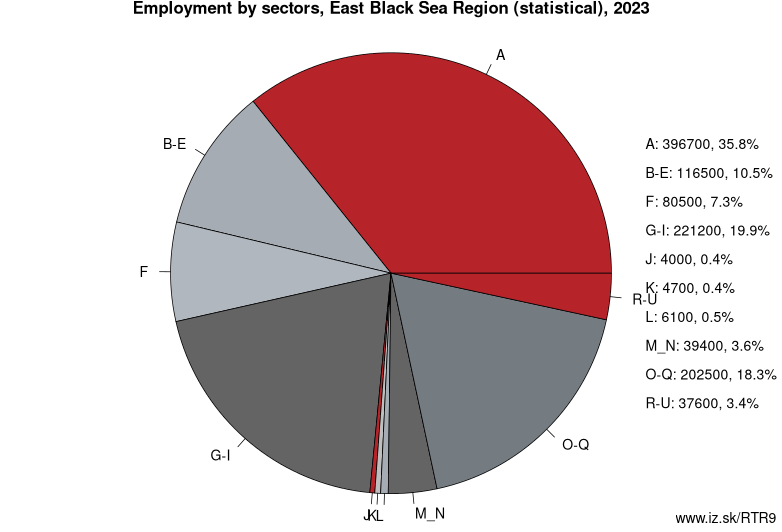
Employment by sectors, East Black Sea Region (statistical)
| NACE r2 | % | NACE r2 | % | ||
|---|---|---|---|---|---|
| A | 367.9 | 33% | B-E | 111.3 | 10% |
| F | 79.9 | 7% | G-I | 236.3 | 21% |
| J | 5.3 | 0% | K | 7.4 | 1% |
| L | 5.2 | 0% | M_N | 41.5 | 4% |
| O-Q | 231 | 21% | R-U | 37.6 | 3% |
| TOTAL | 1123.4 | 100% |
Data for the period year 2025. Source of the data is Eurostat, table [lfst_r_lfe2en2].
Other: Turkey, Northeast Anatolia Region (statistical), Central Anatolia Region (statistical), West Black Sea Region (statistical), West Anatolia Region (statistical), Istanbul Province, West Marmara Region, East Marmara Region (statistical), Aegean Region (statistical), Mediterranean Region (statistical), Central East Anatolia Region (statistical), Southeast Anatolia Region (statistical), East Black Sea Region (statistical)
Neighbours: West Black Sea Region (statistical), Northeast Anatolia Region (statistical), Central Anatolia Region (statistical)
Subregions: Trabzon Subregion, Trabzon Province, Ordu Province, Giresun Province, Rize Province, Artvin Province, Gümüşhane Province
Suggested citation: Michal Páleník: Europe and its regions in numbers - East Black Sea Region (statistical) – TR9, IZ Bratislava, retrieved from: https://www.iz.sk/PTR9, ISBN: 978-80-970204-9-1, DOI:10.5281/zenodo.10200164
 Share
Share Facebook
 Twitter
 News
News