- About us»
- Net income calculator»
- Population aging»
-
-
- Unemployment structure in the Visegrad region
- Development in least developed regions
- Detailed statistics of least developed regions in Slovakia
- Statistics of the least developed regions in Slovakia
-
- Average wage
- Material need benefits
- Meal allowance
- Counties of Slovakia
- Inflation
- Living and Subsistence Minimum
- Unemployment of Czechia and Slovakia
- NACE Classification
-
- Life expectancy
- Gender differences
- Youth unemployment and NEET
- Minimum wage in EU
- Unemployment rates of different age groups
- Share of salaries on GDP
- Long term unemployment
- Unemployment rate
- Percentage of employees ususally working at nights
- Employment rate
- NEET
-
- Bratislava and surroundings
- Kopanice
- Danube river
- lower Vah river
- middle Vár river
- upper Nitra river
- lower Nitra river
- Mining cities
- Kysuce a Orava
- upper Vah river - Liptov
- Spiš cities
- upper Hron river
- Juhoslovenská kotlina
- Košice fold and Torysa river
- upper Zemplín
- lower Zemplín
- EU regions
- NUTS3 regions of Slovakia
- LAU1 dataset
-
-
- Projects and activities
- Inclusive growth»
- Good work
- Project SKRS
- Social system – reality and vision
-
- Education of unemployed
- Young unemployed not taking part in education
- Proposal to change the system of education funding
- Library
- News»
- Contact
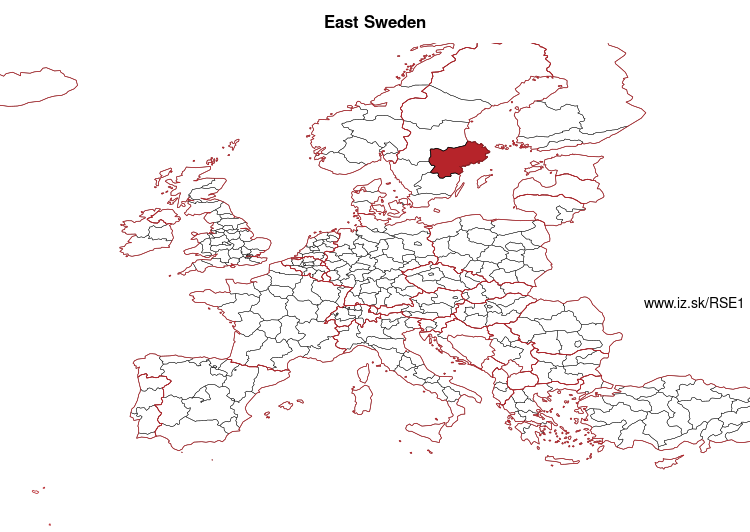
East Sweden – SE1
EU regions: Sweden > East Sweden
| Indicator | Period | Value |
|---|---|---|
| Life long learning | ||
| life long learning participation | 2024 | 38.9 |
| Part time jobs and flexible employment | ||
| percentage of part time workers | 2024 | 17.31 |
| percentage of part time workers, men | 2024 | 12.92 |
| percentage of part time workers, women | 2024 | 22.08 |
| Gender differences | ||
| gender gap in employment rate | 2024 | 97.3 |
| gender gap in unemployment rate | 2024 | 100 |
| Graduates and young people | ||
| unemployment rate of youth with elementary education | 2024 | 40.4 |
| NEET | 2024 | 5.8 |
| Gross domestic product | ||
| GDP per capita in PPS of EU average | 2023 | 130 |
| Employment | ||
| employment rate | 2024 | 76.7 |
| Social exclusion | ||
| people at risk of poverty or social exclusion | 2020 | 16.4 |
East Sweden slovensky: SE1
Subregions: Stockholm, East Middle Sweden
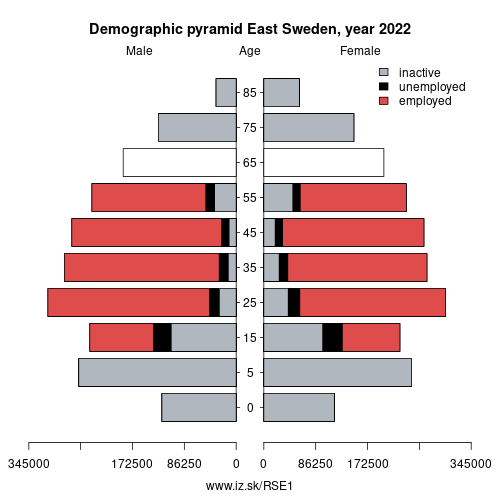
Unemployment
| Indicator | Period | Value |
|---|---|---|
| Unemployment | ||
| unemployment rate | 2024 | 8.9 |
| youth unemployment rate | 2024 | 26.3 |
| Long term unemployment | ||
| long term unemployment | 2024 | 1.8 |
| share of long term unemployed | 2024 | 20.9 |
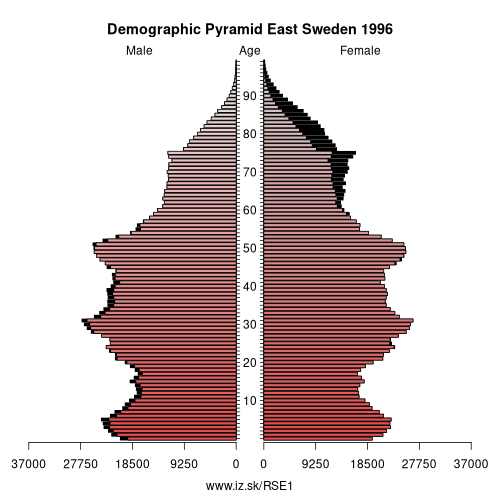
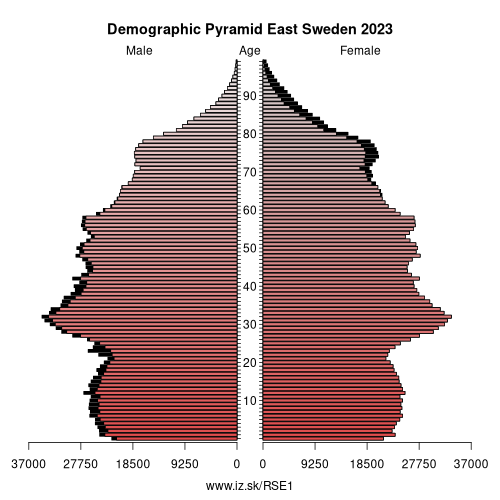
Demographics
| Indicator | Period | Value |
|---|---|---|
| Demographics | ||
| number of inhabitants | 2025 | 4 244 740 |
| population density | 2023 | 93.7 |
| old-age dependency ratio | 2025 | 29.4 |
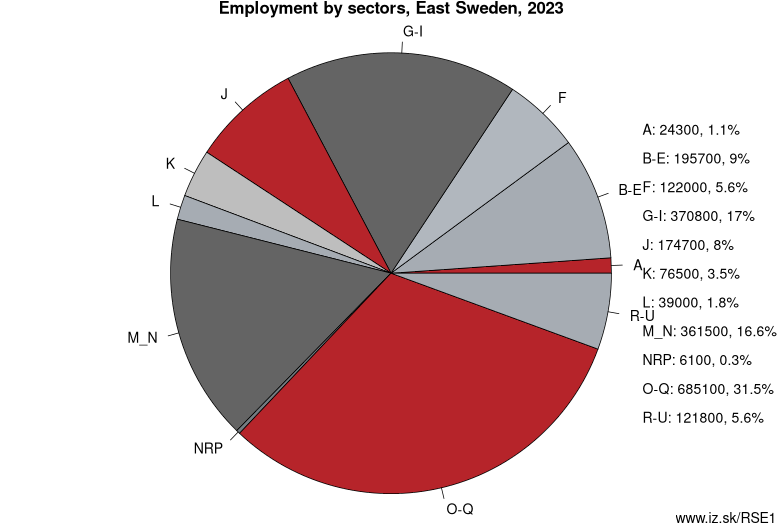
Employment by sectors, East Sweden
| NACE r2 | % | NACE r2 | % | ||
|---|---|---|---|---|---|
| A | 24.4 | 1% | B-E | 187.7 | 9% |
| F | 121.4 | 6% | G-I | 374.3 | 17% |
| J | 169.1 | 8% | K | 74.3 | 3% |
| L | 36.8 | 2% | M_N | 381.1 | 18% |
| NRP | 5.8 | 0% | O-Q | 680.3 | 31% |
| R-U | 117.4 | 5% | TOTAL | 2172.4 | 100% |
Data for the period year 2024. Source of the data is Eurostat, table [lfst_r_lfe2en2].
Other: Sweden, East Sweden, Southern Sweden, Northern Sweden
Neighbours: Northern Sweden, Southern Sweden
Subregions: Stockholm, East Middle Sweden
Suggested citation: Michal Páleník: Europe and its regions in numbers - East Sweden – SE1, IZ Bratislava, retrieved from: https://www.iz.sk/PSE1, ISBN: 978-80-970204-9-1, DOI:10.5281/zenodo.10200164
https://www.iz.sk/en/projects/eu-regions/SE1

 Share
Share Facebook
 Twitter
 News
News