- About us»
- Net income calculator»
- Population aging»
-
- Least developed regions»
-
- Average wage
- Material need benefits
- Meal allowance
- Counties of Slovakia
- Inflation
- Living and Subsistence Minimum
- Unemployment of Czechia and Slovakia
- NACE Classification
-
- Life expectancy
- Gender differences
- Youth unemployment and NEET
- Minimum wage in EU
- Unemployment rates of different age groups
- Share of salaries on GDP
- Employment rate
- Percentage of employees ususally working at nights
- Unemployment rate
- NEET
- Long term unemployment
-
- Bratislava and surroundings
- Kopanice
- Danube river
- lower Vah river
- middle Vár river
- upper Nitra river
- lower Nitra river
- Mining cities
- Kysuce a Orava
- upper Vah river - Liptov
- Spiš cities
- upper Hron river
- Juhoslovenská kotlina
- Košice fold and Torysa river
- upper Zemplín
- lower Zemplín
- EU regions
- NUTS3 regions of Slovakia
- LAU1 dataset
-
- Projects and activities
- Inclusive growth»
- Good work
- Project SKRS
- Social system – reality and vision
- Library
-
- Education of unemployed
- Young unemployed not taking part in education
- Proposal to change the system of education funding
- News»
- Contact
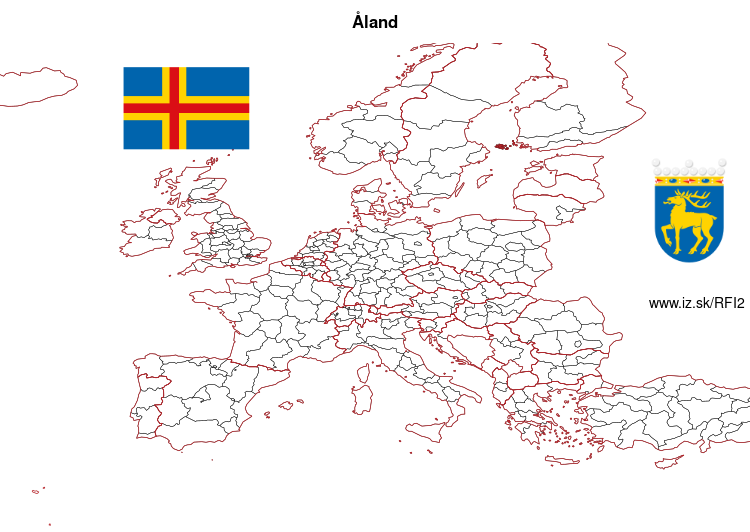
Åland – FI2

| Indicator | Period | Value |
|---|---|---|
| Life long learning | ||
| life long learning participation | 2024 | 23.8 |
| Part time jobs and flexible employment | ||
| percentage of part time workers | 2024 | 22.38 |
| percentage of part time workers, women | 2022 | 28.17 |
| Gender differences | ||
| gender gap in employment rate | 2024 | 102.24 |
| Gross domestic product | ||
| GDP per capita in PPS of EU average | 2023 | 117 |
| Employment | ||
| employment rate | 2024 | 81.4 |
Åland slovensky: FI2
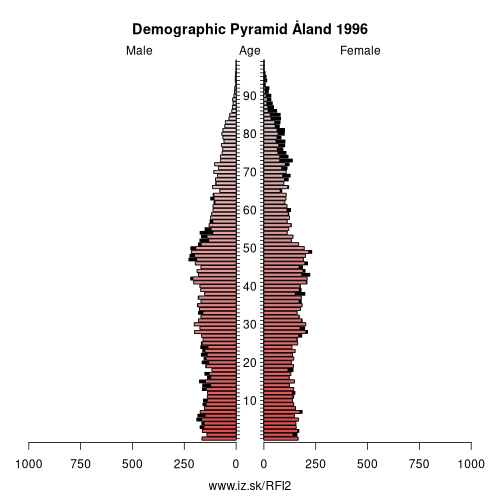
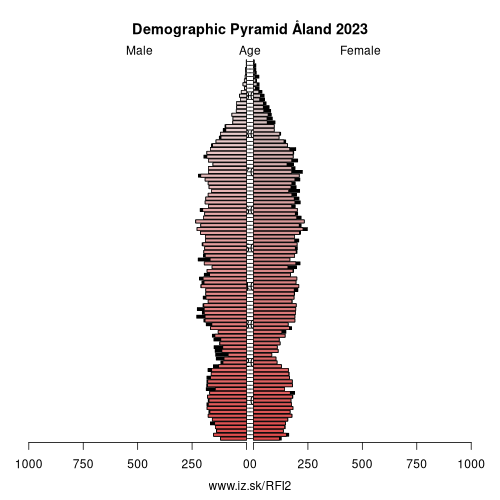
Demographics

| Indicator | Period | Value |
|---|---|---|
| Demographics | ||
| number of inhabitants | 2025 | 30 654 |
| population density | 2023 | 19.6 |
| old-age dependency ratio | 2025 | 41.1 |

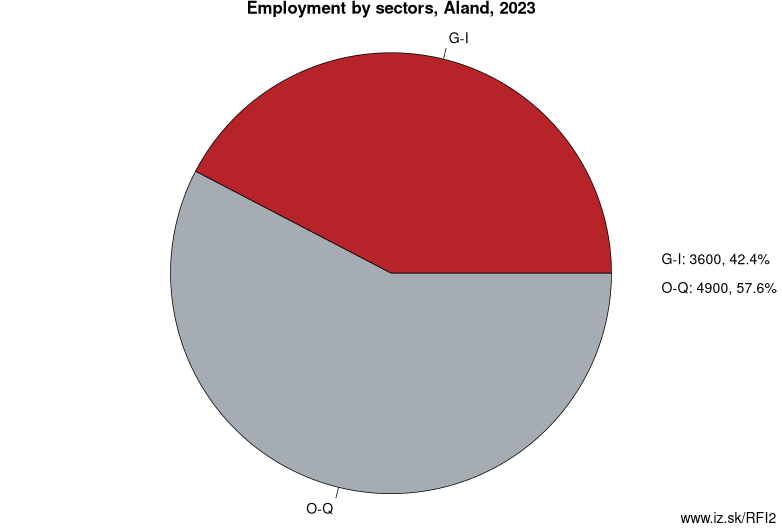
Employment by sectors, Åland
| NACE r2 | % | NACE r2 | % | ||
|---|---|---|---|---|---|
| G-I | 3.8 | 25% | O-Q | 4.5 | 29% |
| TOTAL | 15.5 | 100% |
Data for the period year 2024. Source of the data is Eurostat, table [lfst_r_lfe2en2].

Other: Finland, Åland, Mainland Finland
Suggested citation: Michal Páleník: Europe and its regions in numbers - Åland – FI2, IZ Bratislava, retrieved from: https://www.iz.sk/PFI2, ISBN: 978-80-970204-9-1, DOI:10.5281/zenodo.10200164
https://www.iz.sk/en/projects/eu-regions/FI2

 Share
Share Facebook
 Twitter
 News
News