Åland – FI20
EU regions: Finland > Åland > Åland
| Indicator | Period | Value |
|---|---|---|
| Life long learning | ||
| life long learning participation | 2025 | 27.1 |
| Part time jobs and flexible employment | ||
| percentage of part time workers | 2024 | 22.38 |
| percentage of part time workers, women | 2022 | 28.17 |
| Gender differences | ||
| gender gap in employment rate | 2025 | 96.07 |
| Gross domestic product | ||
| GDP per capita in PPS of EU average | 2024 | 111 |
| Employment | ||
| employment rate | 2025 | 82.3 |
Åland slovensky: FI20
Subregions: Åland
Demographics
| Indicator | Period | Value |
|---|---|---|
| Demographics | ||
| number of inhabitants | 2025 | 30 654 |
| population density | 2024 | 19.7 |
| old-age dependency ratio | 2025 | 41.1 |
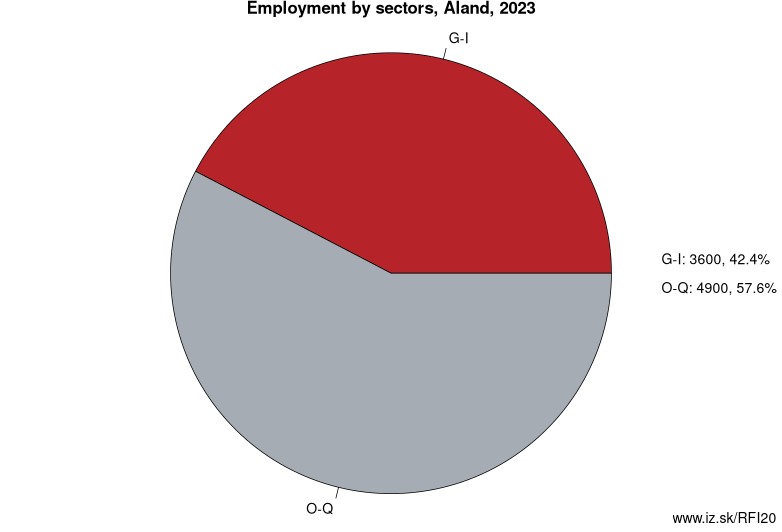
Employment by sectors, Åland
| NACE r2 | % | NACE r2 | % | ||
|---|---|---|---|---|---|
| G-I | 3.1 | 20% | O-Q | 5.1 | 33% |
| TOTAL | 15.3 | 100% |
Data for the period year 2025. Source of the data is Eurostat, table [lfst_r_lfe2en2].
Subregions: Åland
Suggested citation: Michal Páleník: Europe and its regions in numbers - Åland – FI20, IZ Bratislava, retrieved from: https://www.iz.sk/PFI20, ISBN: 978-80-970204-9-1, DOI:10.5281/zenodo.10200164
https://www.iz.sk/en/projects/eu-regions/FI20
 Share
Share Facebook
 Twitter
 News
News