Norway – NO
Norway slovensky: NO
Subregions: Norway, Oslo og Akershus, Innlandet, Sør-Østlandet, Agder og Rogaland, Vestlandet, Trøndelag, Nord-Norge
Unemployment
| Indicator | Period | Value |
|---|---|---|
| Unemployment | ||
| unemployment rate | 2025 | 4.6 |
| youth unemployment rate | 2025 | 14 |
| unemployment rate of low educated people | 2026q1 | 13.7 |
| Long term unemployment | ||
| long term unemployment | 2026q1 | 0.7 |
| share of long term unemployed | 2025 | 15.3 |
Composition of population according to age group, education and economic activity, Norway
| Age group | Low education | Middle education | High education |
|---|---|---|---|
| Y20-29 | P: 70.4 E: 41.6; U: 3.6; I: 25.2 | P: 334.2 E: 248.0; U: 13.5; I: 72.7 | P: 290.8 E: 240.2; U: 12.0; I: 38.6 |
| Y30-39 | P: 119.9 E: 79.3; U: 5.1; I: 35.5 | P: 228.8 E: 196.6; U: 6.3; I: 25.9 | P: 430.6 E: 390.1; U: 12.0; I: 28.5 |
| Y40-49 | P: 107.7 E: 66.6; U: 5.0; I: 36.1 | P: 241.1 E: 201.0; U: 3.6; I: 36.5 | P: 368.0 E: 331.7; U: 7.5; I: 28.8 |
| Y50-59 | P: 127.2 E: 71.4; U: 2.8; I: 53.0 | P: 300.5 E: 236.2; U: 3.9; I: 60.4 | P: 316.8 E: 283.8; U: 4.2; I: 28.8 |
| Y60-69 | P: 125.3 E: 50.7; U: 0.9; I: 73.7 | P: 269.8 E: 135.4; U: 1.8; I: 132.6 | P: 221.4 E: 134.0; U: 2.8; I: 84.6 |
Note: in thousands in 2024, according to labour force sample survey. P – total population, E – employed, U – unemployed, I – number of economically inactive
Demographics
| Indicator | Period | Value |
|---|---|---|
| Demographics | ||
| number of inhabitants | 2025 | 5 594 340 |
| population density | 2024 | 15.3 |
| old-age dependency ratio | 2025 | 29.2 |
| Population ageing | ||
| unemployment rate – over 55 years | 2026q1 | 2.2 |
| aggregate replacement ratio | 2025 | 0.55 |
| aggregate replacement ratio – females | 2025 | 0.59 |
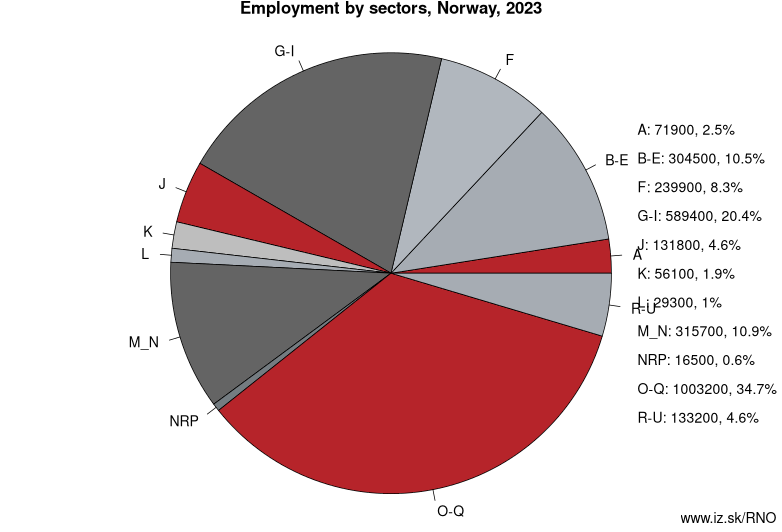
Employment by sectors, Norway
| NACE r2 | % | NACE r2 | % | ||
|---|---|---|---|---|---|
| A | 75.8 | 3% | B-E | 291.7 | 10% |
| F | 227.6 | 8% | G-I | 612.6 | 21% |
| J | 135.1 | 5% | K | 53.2 | 2% |
| L | 32.6 | 1% | M_N | 311.7 | 11% |
| NRP | 28.6 | 1% | O-Q | 1008 | 34% |
| R-U | 146 | 5% | TOTAL | 2922.9 | 100% |
Data for the period year 2025. Source of the data is Eurostat, table [lfst_r_lfe2en2].
Other: Norway, Netherlands
Subregions: Norway, Oslo og Akershus, Innlandet, Sør-Østlandet, Agder og Rogaland, Vestlandet, Trøndelag, Nord-Norge
Suggested citation: Michal Páleník: Europe and its regions in numbers - Norway – NO, IZ Bratislava, retrieved from: https://www.iz.sk/PNO, ISBN: 978-80-970204-9-1, DOI:10.5281/zenodo.10200164
https://www.iz.sk/en/projects/eu-regions/NO
 Share
Share Facebook
 Twitter
 News
News