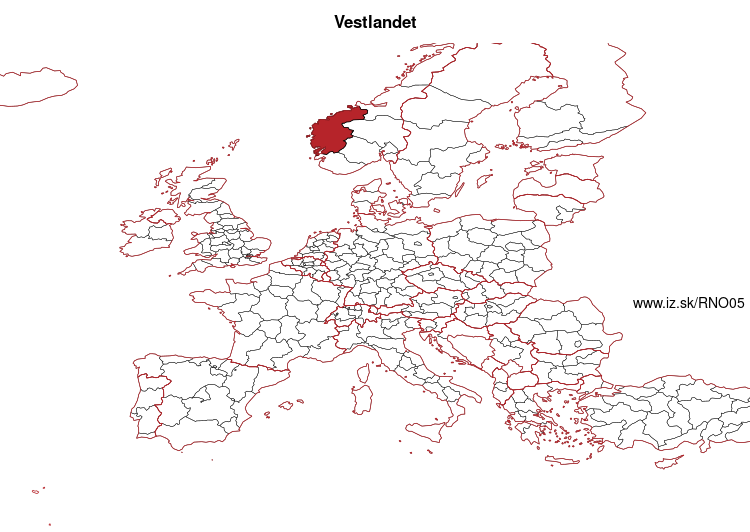
Vestlandet – NO05
EU regions: Norway > Norway > Vestlandet
| Indicator | Period | Value |
|---|---|---|
| Life long learning | ||
| life long learning participation | 2015 | 20 |
| Part time jobs and flexible employment | ||
| percentage of part time workers | 2015 | 23.23 |
| percentage of part time workers, men | 2015 | 11.71 |
| percentage of part time workers, women | 2015 | 36.71 |
| Gender differences | ||
| gender gap in employment rate | 2015 | 94.26 |
| gender gap in unemployment rate | 2015 | 90.24 |
| Graduates and young people | ||
| unemployment rate of youth with elementary education | 2015 | 14.4 |
| NEET | 2015 | 3.8 |
| Employment | ||
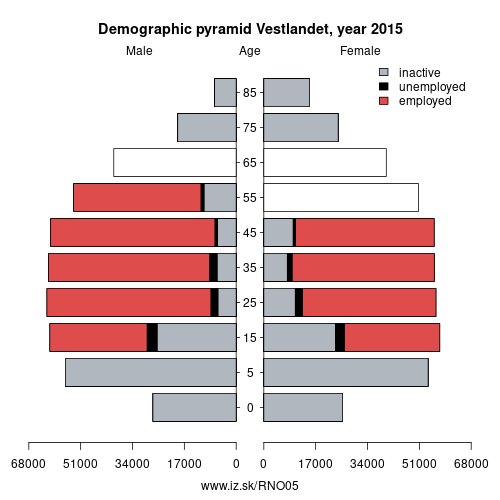
| employment rate | 2015 | 76.2 |
| Social exclusion | ||
| people at risk of poverty or social exclusion | 2020 | 19.8 |
Vestlandet slovensky: NO05
Subregions: Hordaland, Sogn og Fjordane, Møre og Romsdal
Unemployment
| Indicator | Period | Value |
|---|---|---|
| Unemployment | ||
| unemployment rate | 2015 | 4 |
| youth unemployment rate | 2015 | 9.4 |
| Long term unemployment | ||
| long term unemployment | 2015 | 0.9 |
| share of long term unemployed | 2015 | 23.5 |
Demographics
| Indicator | Period | Value |
|---|---|---|
| Demographics | ||
| number of inhabitants | 2020 | 905 335 |
| population density | 2020 | 19.1 |
| old-age dependency ratio | 2020 | 28.3 |
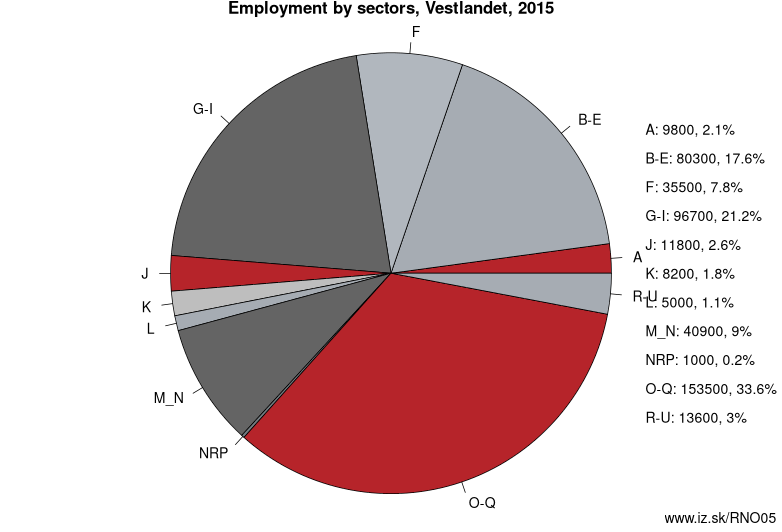
Employment by sectors, Vestlandet
| NACE r2 | % | NACE r2 | % | ||
|---|---|---|---|---|---|
| A | 9.8 | 2% | B-E | 80.3 | 18% |
| F | 35.5 | 8% | G-I | 96.7 | 21% |
| J | 11.8 | 3% | K | 8.2 | 2% |
| L | 5 | 1% | M_N | 40.9 | 9% |
| NRP | 1 | 0% | O-Q | 153.5 | 34% |
| R-U | 13.6 | 3% | TOTAL | 456.3 | 100% |
Data for the period year 2015. Source of the data is Eurostat, table [lfst_r_lfe2en2].
Other: Norway, Oslo og Akershus, Sør-Østlandet, Nord-Norge, Agder og Rogaland, Trøndelag, Vestlandet, Innlandet
Neighbours: Trøndelag, Sør-Østlandet, Agder og Rogaland, Innlandet
Subregions: Hordaland, Sogn og Fjordane, Møre og Romsdal
Suggested citation: Michal Páleník: Europe and its regions in numbers - Vestlandet – NO05, IZ Bratislava, retrieved from: https://www.iz.sk/PNO05, ISBN: 978-80-970204-9-1, DOI:10.5281/zenodo.10200164
https://www.iz.sk/en/projects/eu-regions/NO05
Similar articles
Navigation:
- Short news
- Local Administrative Units data of Visegrad countries open data
- Projects and activities
- European regions
- Random region: Austria, East Austria, Wien
 Share
Share Facebook
 Twitter
 News
News