Innlandet – NO02
EU regions: Norway > Norway > Innlandet
| Indicator | Period | Value |
|---|---|---|
| Life long learning | ||
| life long learning participation | 2025 | 20.3 |
| Part time jobs and flexible employment | ||
| percentage of part time workers | 2025 | 22.43 |
| percentage of part time workers, men | 2025 | 17.1 |
| percentage of part time workers, women | 2025 | 28.21 |
| Gender differences | ||
| gender gap in employment rate | 2025 | 96.96 |
| gender gap in unemployment rate | 2016 | 57.89 |
| Graduates and young people | ||
| unemployment rate of youth with elementary education | 2016 | 19.7 |
| NEET | 2016 | 6.5 |
| Gross domestic product | ||
| GDP per capita in PPS of EU average | 2021 | 104 |
| Employment | ||
| employment rate | 2025 | 74.5 |
| Social exclusion | ||
| people at risk of poverty or social exclusion | 2020 | 17.3 |
Innlandet slovensky: NO02
Unemployment
| Indicator | Period | Value |
|---|---|---|
| Unemployment | ||
| unemployment rate | 2025 | 4.4 |
| youth unemployment rate | 2016 | 12.6 |
| Long term unemployment | ||
| long term unemployment | 2016 | 1.4 |
| share of long term unemployed | 2016 | 30.4 |
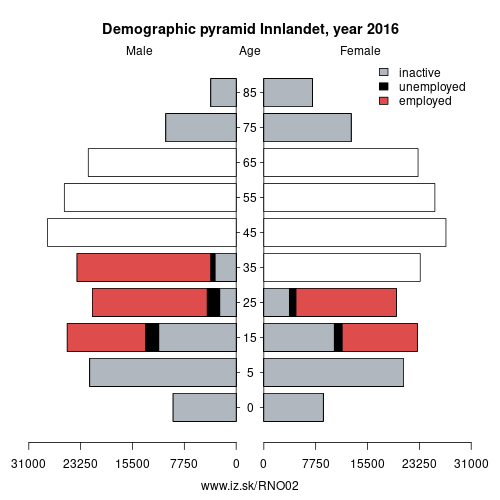
Demographics
| Indicator | Period | Value |
|---|---|---|
| Demographics | ||
| number of inhabitants | 2025 | 377 556 |
| population density | 2024 | 7.6 |
| old-age dependency ratio | 2025 | 38.9 |
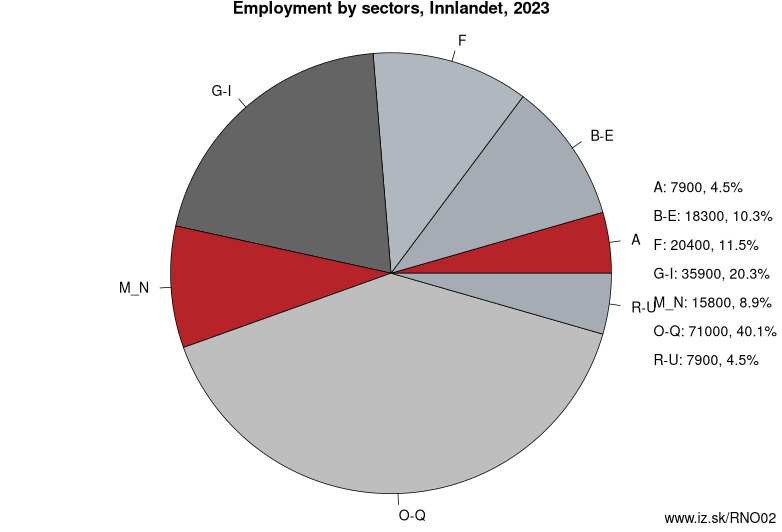
Employment by sectors, Innlandet
| NACE r2 | % | NACE r2 | % | ||
|---|---|---|---|---|---|
| A | 7.5 | 4% | B-E | 26.1 | 14% |
| F | 14.2 | 8% | G-I | 38.8 | 21% |
| M_N | 14.2 | 8% | O-Q | 69.8 | 37% |
| R-U | 7.8 | 4% | TOTAL | 189 | 100% |
Data for the period year 2025. Source of the data is Eurostat, table [lfst_r_lfe2en2].
Other: Norway, Oslo og Akershus, Sør-Østlandet, Nord-Norge, Agder og Rogaland, Trøndelag, Vestlandet, Innlandet
Neighbours: Trøndelag, Sør-Østlandet, Middle Norrland, Vestlandet, North Middle Sweden, Oslo og Akershus
Suggested citation: Michal Páleník: Europe and its regions in numbers - Innlandet – NO02, IZ Bratislava, retrieved from: https://www.iz.sk/PNO02, ISBN: 978-80-970204-9-1, DOI:10.5281/zenodo.10200164
https://www.iz.sk/en/projects/eu-regions/NO02
 Share
Share Facebook
 Twitter
 News
News