Comparison of age structure of dentists
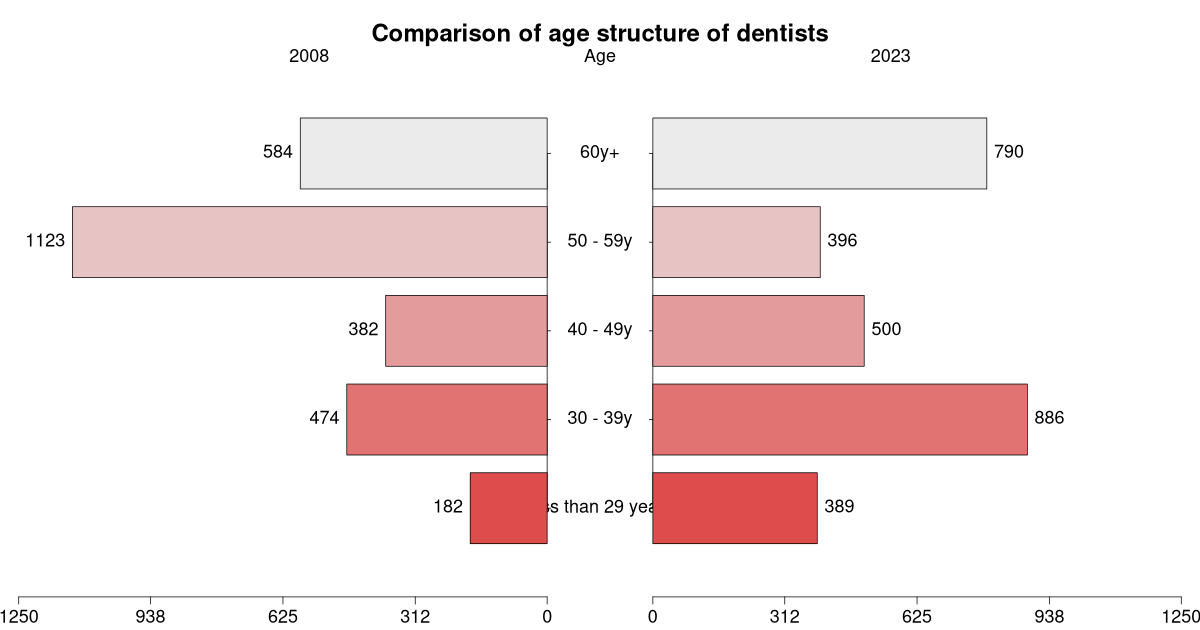
The increase of the number of dentists ha been driven by ageing of dentists (so the largest age group is 60+) and increasing number of young dentists, which is a positive sign.
| vek | 2008 | 2024 | increase | increase in % |
|---|---|---|---|---|
| less than 29 years | 182 | 333 | 151 | 83 % |
| 30 – 39y | 474 | 979 | 505 | 107 % |
| 40 – 49y | 382 | 496 | 114 | 30 % |
| 50 – 59y | 1123 | 421 | -702 | -63 % |
| 60y+ | 584 | 737 | 153 | 26 % |
| Total | 2745 | 2966 | 221 | 7 % |
Suggested citation: Michal Páleník: 30 graphs on ageing - Comparison of age structure of dentists, IZ Bratislava, retrieved from: https://www.iz.sk/30-graphs-on-aging/comparison-of-age-structure-of-dentists, doi:10.5281/zenodo.6079128
 Tento článok je súčasťou projektu Politiky zamestnanosti realizovaného Inštitútom zamestnanosti. Tento projekt je podporený z Európskeho sociálneho fondu v rámci OP EVS.
https://www.iz.sk/30-graphs-on-aging/comparison-of-age-structure-of-dentists
 Share
Share Facebook
 Twitter
 News
News