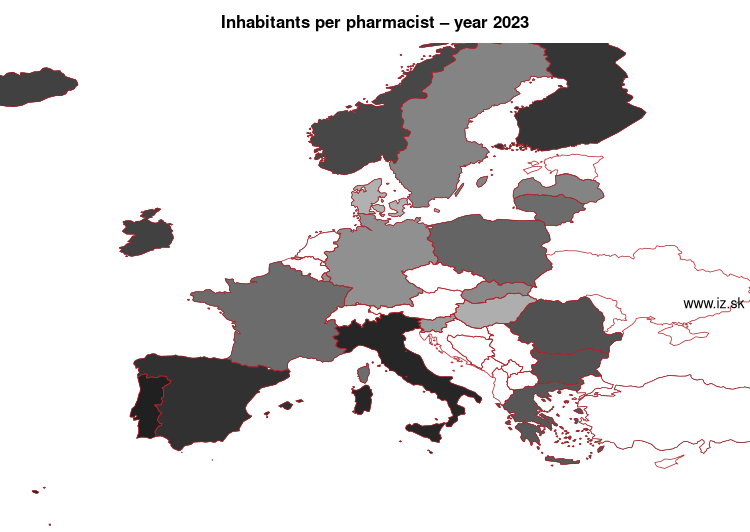
Inhabitants per pharmacist – year 2024
| Order | Code | Region | Value | Note |
|---|---|---|---|---|
| 1. | Malta | MT | 455,81 | |
| 2. | Portugal | PT | 625,38 | |
| 3. | Italy | IT | 645,03 | |
| 4. | Finland | FI | 705,46 | period 2025 |
| 5. | Spain | ES | 730,91 | |
| 6. | Ireland | IE | 767,75 | period 2025 |
| 7. | Iceland | IS | 807,98 | period 2025 |
| 8. | Norway | NO | 811,34 | |
| 9. | Bulgaria | BG | 861,76 | period 2025 |
| 10. | Romania | RO | 898,08 | |
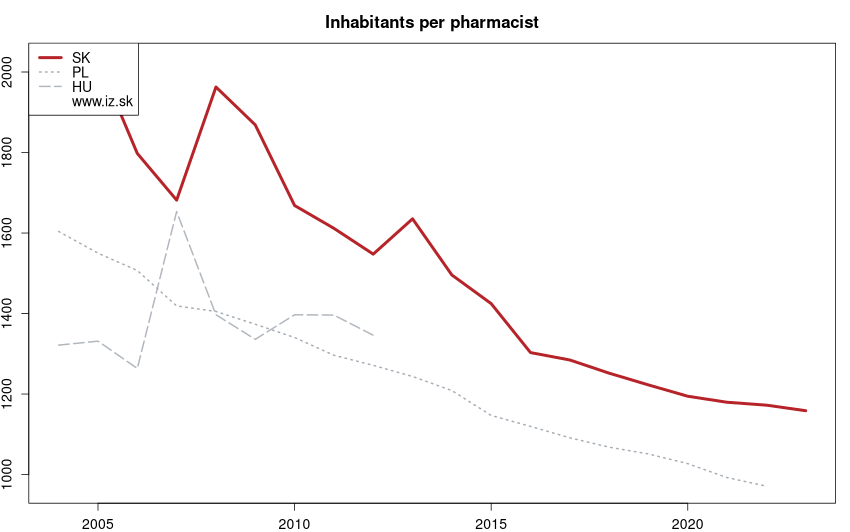
| 11. | Poland | PL | 971,17 | period 2022 |
| 12. | France | FR | 1015,22 | |
| 13. | Lithuania | LT | 1017,48 | period 2025 |
| 14. | Sweden | SE | 1125,99 | |
| 15. | Slovakia | SK | 1135,27 | |
| 16. | Latvia | LV | 1142,15 | period 2025 |
| 17. | Luxembourg | LU | 1174,66 | period 2012 |
| 18. | Germany | DE | 1186,21 | |
| 19. | Liechtenstein | LI | 1189,72 | |
| 20. | Slovenia | SI | 1244,82 | |
| 21. | Denmark | DK | 1329,52 | period 2023 |
| 22. | Hungary | HU | 1375,74 | period 2012 |
| 23. | North Macedonia | MK | 1761,01 | period 2021 |
| 24. | Turkey | TR | 2020,57 | |
| 25. | Netherlands | NL | 3214,84 | |
| 26. | Serbia | RS | 5054,85 |
Data for the period year 2024. Source of the data is Eurostat, table [hlth_rs_prs2].
See also:
Suggested citation: Michal Páleník: 30 graphs on ageing - Inhabitants per pharmacist – year 2024, IZ Bratislava, retrieved from: https://www.iz.sk/30-graphs-on-ageing/inhabitants-per-pharmacist, doi:10.5281/zenodo.6079128
https://www.iz.sk/30-graphs-on-ageing/inhabitants-per-pharmacist

 Share
Share Facebook
 Twitter
 News
News