North Macedonia – MK
North Macedonia slovensky: MK
Subregions: North Macedonia, North Macedonia
Unemployment
| Indicator | Period | Value |
|---|---|---|
| Unemployment | ||
| unemployment rate | 2026q1 | 11.5 |
| youth unemployment rate | 2026q1 | 28.3 |
| unemployment rate of low educated people | 2026q1 | 18.6 |
| Long term unemployment | ||
| long term unemployment | 2026q1 | 7.3 |
| share of long term unemployed | 2025 | 67.6 |
Composition of population according to age group, education and economic activity, North Macedonia
| Age group | Low education | Middle education | High education |
|---|---|---|---|
| Y20-29 | P: 17.0 E: 5.8; U: 3.4; I: 7.8 | P: 155.9 E: 70.3; U: 20.8; I: 64.8 | P: 42.0 E: 30.9; U: 6.6; I: 4.5 |
| Y30-39 | P: 41.2 E: 17.4; U: 6.5; I: 17.3 | P: 111.0 E: 81.4; U: 12.6; I: 17.0 | P: 90.6 E: 77.4; U: 6.3; I: 6.9 |
| Y40-49 | P: 72.5 E: 32.7; U: 7.4; I: 32.4 | P: 125.1 E: 102.2; U: 9.0; I: 13.9 | P: 57.9 E: 53.3; U: 2.2; I: 2.4 |
| Y50-59 | P: 85.9 E: 35.0; U: 4.8; I: 46.1 | P: 127.1 E: 92.1; U: 9.4; I: 25.6 | P: 38.4 E: 33.6; U: 1.2; I: 3.6 |
| Y60-69 | P: 88.7 E: 15.1; U: 1.7; I: 71.9 | P: 106.7 E: 25.5; U: 1.6; I: 79.6 | P: 40.0 E: 15.3; U: 0.4; I: 24.3 |
Note: in thousands in 2024, according to labour force sample survey. P – total population, E – employed, U – unemployed, I – number of economically inactive
Demographics
| Indicator | Period | Value |
|---|---|---|
| Demographics | ||
| number of inhabitants | 2025 | 1 822 612 |
| population density | 2024 | 73.3 |
| old-age dependency ratio | 2025 | 28.7 |
| Population ageing | ||
| unemployment rate – over 55 years | 2026q1 | 8 |
| aggregate replacement ratio | 2024 | 0.51 |
| aggregate replacement ratio – females | 2024 | 0.51 |
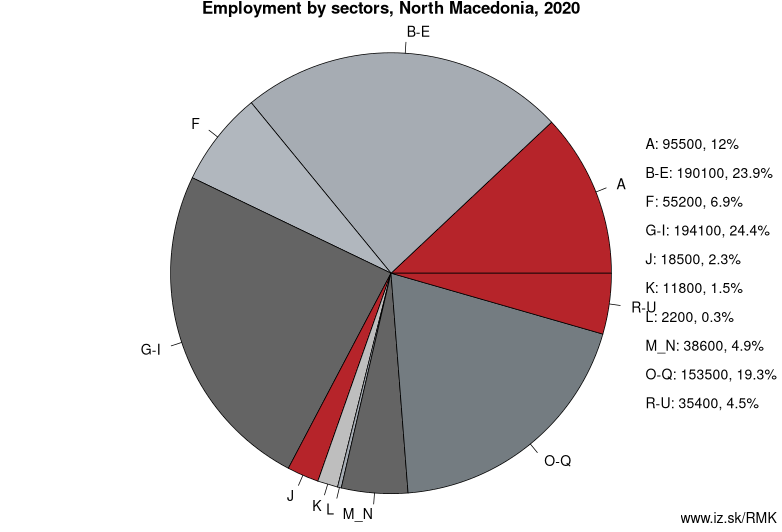
Employment by sectors, North Macedonia
| NACE r2 | % | NACE r2 | % | ||
|---|---|---|---|---|---|
| A | 70.3 | 10% | B-E | 156.3 | 22% |
| F | 46.9 | 7% | G-I | 176 | 25% |
| J | 23.7 | 3% | K | 10.8 | 2% |
| L | 1.1 | 0% | M_N | 41.2 | 6% |
| O-Q | 143.6 | 20% | R-U | 34.6 | 5% |
| TOTAL | 704.6 | 100% |
Data for the period year 2025. Source of the data is Eurostat, table [lfst_r_lfe2en2].
Other: Montenegro, North Macedonia, Malta
Neighbours: Greece, Serbia, Albania, Bulgaria
Subregions: North Macedonia, North Macedonia
Suggested citation: Michal Páleník: Europe and its regions in numbers - North Macedonia – MK, IZ Bratislava, retrieved from: https://www.iz.sk/PMK, ISBN: 978-80-970204-9-1, DOI:10.5281/zenodo.10200164
https://www.iz.sk/en/projects/eu-regions/MK
 Share
Share Facebook
 Twitter
 News
News