Number of health care employees
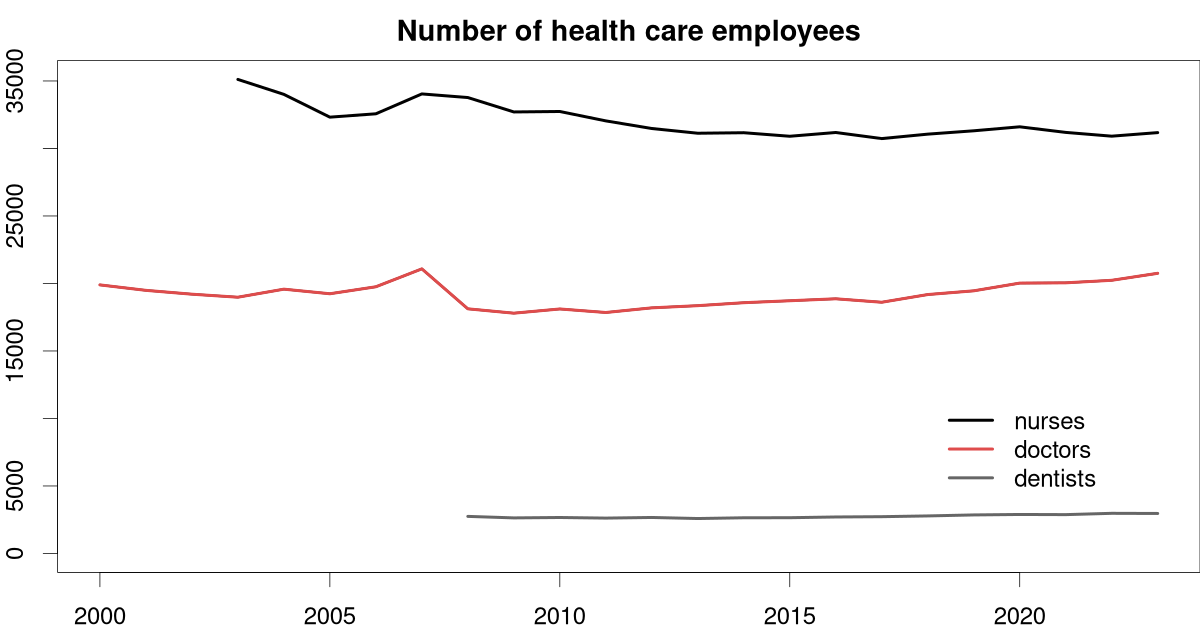
This graph shows an increase of the number of doctors in Slovak health care. This is partially a result of older doctors' decisions not to enter retirement. The decrease is visible mainly in the occupation of nurses. Number of dentists is stable at around 2700.
Continuous decrease of nurses since 2008 will worsen health care of ageing population. Smaller increase of doctors will not make situation in health care sector in Slovakia better.
| rok | dentists | doctors | nurses | total |
|---|---|---|---|---|
| 2000 | 19 894 | |||
| 2001 | 19 489 | |||
| 2002 | 19 205 | |||
| 2003 | 18 981 | 35 113 | ||
| 2004 | 19 577 | 34 007 | ||
| 2005 | 19 237 | 32 319 | ||
| 2006 | 19 754 | 32 568 | ||
| 2007 | 21 081 | 34 040 | ||
| 2008 | 2745 | 18 121 | 33 772 | 54 638 |
| 2009 | 2633 | 17 798 | 32 705 | 53 136 |
| 2010 | 2663 | 18 110 | 32 739 | 53 512 |
| 2011 | 2618 | 17 849 | 32 043 | 52 510 |
| 2012 | 2665 | 18 193 | 31 478 | 52 336 |
| 2013 | 2586 | 18 355 | 31 128 | 52 069 |
| 2014 | 2642 | 18 574 | 31 166 | 52 382 |
| 2015 | 2647 | 18 719 | 30 904 | 52 270 |
| 2016 | 2701 | 18 864 | 31 183 | 52 748 |
| 2017 | 2723 | 18 608 | 30 732 | 52 063 |
| 2018 | 2779 | 19 178 | 31 061 | 53 018 |
| 2019 | 2853 | 19 454 | 31 309 | 53 616 |
| 2020 | 2887 | 20 026 | 31 604 | 54 517 |
| 2021 | 2875 | 20 047 | 31 190 | 54 112 |
| 2022 | 2972 | 20 234 | 30 910 | 54 116 |
| 2023 | 2961 | 20 753 | 31 174 | 54 888 |
| 2024 | 2966 | 21 403 | 31 395 | 55 764 |
| Mean | 19 260 |
Suggested citation: Michal Páleník: 30 graphs on ageing - Number of health care employees, IZ Bratislava, retrieved from: https://www.iz.sk/30-graphs-on-aging/number-of-health-care-employees, doi:10.5281/zenodo.6079128
 Tento článok je súčasťou projektu Politiky zamestnanosti realizovaného Inštitútom zamestnanosti. Tento projekt je podporený z Európskeho sociálneho fondu v rámci OP EVS.
Doctors
How does the structure and age of doctors change? How did the structure of medicine students change?. . .
Similar articles
Age structure of doctors, Age structure of doctors by founder, Age structure of doctors in regions, Number of medicine students, Doctors, The impact of aging on the health care sector in Slovakia – forecast of demand and supply until 2030 .pdf, Comparison of age structure of nurses and doctors, Inhabitants per physician – year 2024
 Share
Share Facebook
 Twitter
 News
News