Age development of doctors
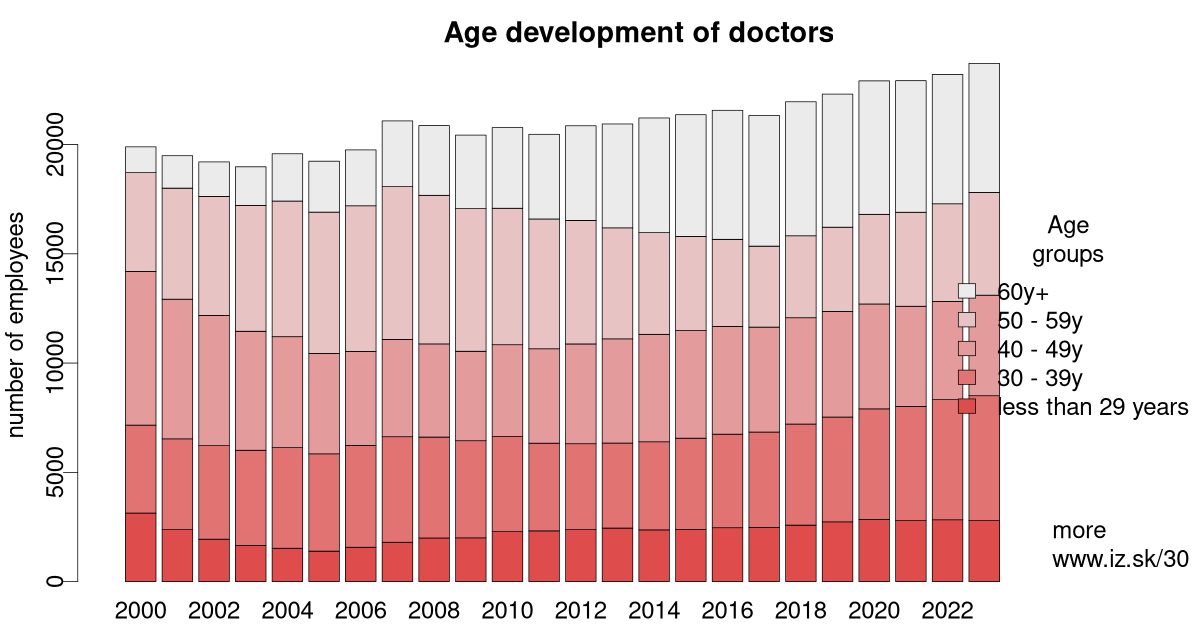
Age development of doctors in Slovakia is characterized by aging of older doctors and inflow of young doctors. Middle generation is missing.
| rok | less than 29 years | 30 – 39y | 40 – 49y | 50 – 59y | 60y+ | total |
|---|---|---|---|---|---|---|
| 2000 | 3139 | 4022 | 7030 | 4528 | 1175 | 19 894 |
| 2001 | 2379 | 4155 | 6390 | 5081 | 1484 | 19 489 |
| 2002 | 1942 | 4286 | 5949 | 5450 | 1578 | 19 205 |
| 2003 | 1654 | 4357 | 5444 | 5761 | 1765 | 18 981 |
| 2004 | 1527 | 4603 | 5078 | 6206 | 2163 | 19 577 |
| 2005 | 1395 | 4451 | 4592 | 6470 | 2329 | 19 237 |
| 2006 | 1573 | 4657 | 4302 | 6666 | 2556 | 19 754 |
| 2007 | 1801 | 4831 | 4450 | 6992 | 3007 | 21 081 |
| 2008 | 1998 | 4616 | 4263 | 6799 | 3190 | 20 866 |
| 2009 | 2004 | 4445 | 4091 | 6529 | 3362 | 20 431 |
| 2010 | 2288 | 4351 | 4201 | 6244 | 3689 | 20 773 |
| 2011 | 2322 | 4012 | 4320 | 5940 | 3873 | 20 467 |
| 2012 | 2379 | 3932 | 4565 | 5649 | 4333 | 20 858 |
| 2013 | 2450 | 3892 | 4768 | 5078 | 4753 | 20 941 |
| 2014 | 2368 | 4031 | 4917 | 4656 | 5244 | 21 216 |
| 2015 | 2387 | 4177 | 4922 | 4311 | 5569 | 21 366 |
| 2016 | 2468 | 4279 | 4932 | 3983 | 5903 | 21 565 |
| 2017 | 2480 | 4364 | 4803 | 3704 | 5980 | 21 331 |
| 2018 | 2585 | 4625 | 4865 | 3750 | 6132 | 21 957 |
| 2019 | 2736 | 4795 | 4836 | 3852 | 6088 | 22 307 |
| 2020 | 2843 | 5062 | 4799 | 4103 | 6106 | 22 913 |
| 2021 | 2790 | 5223 | 4587 | 4302 | 6020 | 22 922 |
| 2022 | 2830 | 5503 | 4487 | 4470 | 5916 | 23 206 |
| 2023 | 2790 | 5717 | 4601 | 4703 | 5903 | 23 714 |
| 2024 | 2874 | 6058 | 4804 | 4832 | 5801 | 24 369 |
| Mean | 2320 | 4578 | 4880 | 5202 | 4157 | 21 137 |
Suggested citation: Michal Páleník: 30 graphs on ageing - Age development of doctors, IZ Bratislava, retrieved from: https://www.iz.sk/30-graphs-on-ageing/age-development-of-doctors, doi:10.5281/zenodo.6079128
 Tento článok je súčasťou projektu Politiky zamestnanosti realizovaného Inštitútom zamestnanosti. Tento projekt je podporený z Európskeho sociálneho fondu v rámci OP EVS.
https://www.iz.sk/30-graphs-on-ageing/age-development-of-doctors
 Share
Share Facebook
 Twitter
 News
News