Age structure of doctors by founder
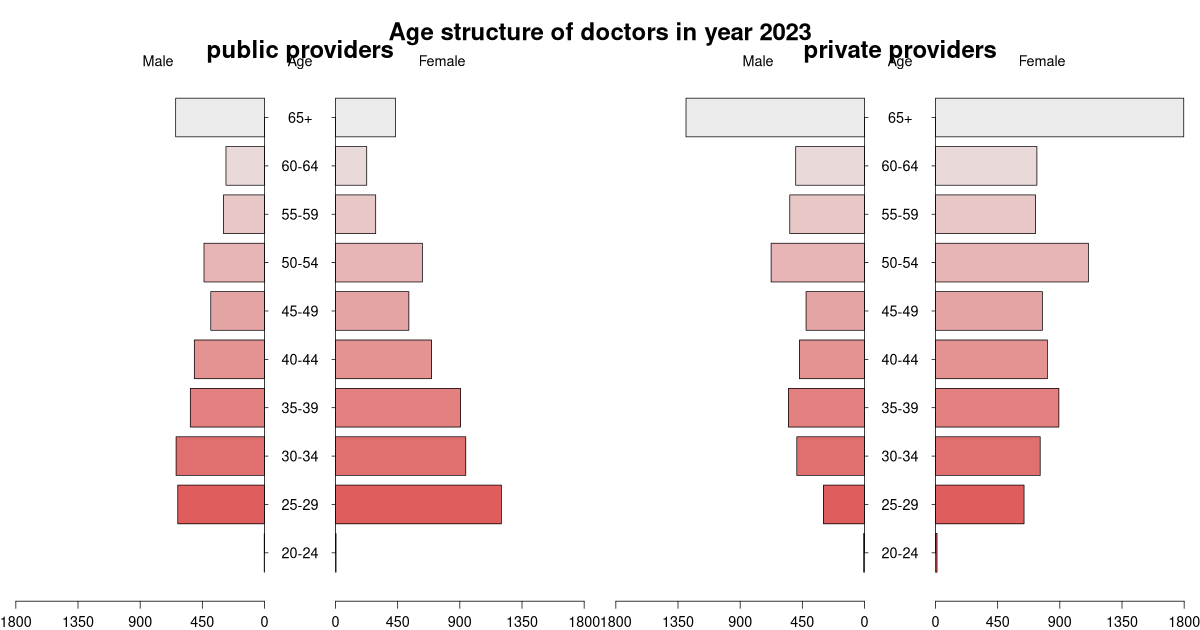
Age structure of doctors by founder type – either public providers or privately owned providers.
| age | male public providers | female public providers | total public providers | male private providers | female private providers | total private providers | total |
|---|---|---|---|---|---|---|---|
| 20-24 | 5 | 2 | 7 | 3 | 10 | 13 | 20 |
| 25-29 | 653 | 1198 | 1851 | 338 | 665 | 1003 | 2854 |
| 30-34 | 694 | 988 | 1682 | 525 | 918 | 1443 | 3125 |
| 35-39 | 524 | 884 | 1408 | 572 | 953 | 1525 | 2933 |
| 40-44 | 495 | 812 | 1307 | 500 | 912 | 1412 | 2719 |
| 45-49 | 414 | 522 | 936 | 429 | 720 | 1149 | 2085 |
| 50-54 | 465 | 631 | 1096 | 645 | 1115 | 1760 | 2856 |
| 55-59 | 303 | 361 | 664 | 539 | 773 | 1312 | 1976 |
| 60-64 | 280 | 208 | 488 | 478 | 698 | 1176 | 1664 |
| 65+ | 628 | 435 | 1063 | 1300 | 1774 | 3074 | 4137 |
| Total | 4461 | 6041 | 10 502 | 5329 | 8538 | 13 867 | 24 369 |
Suggested citation: Michal Páleník: 30 graphs on ageing - Age structure of doctors by founder, IZ Bratislava, retrieved from: https://www.iz.sk/30-graphs-on-ageing/age-structure-of-doctors-by-founder, doi:10.5281/zenodo.6079128
https://www.iz.sk/30-graphs-on-ageing/age-structure-of-doctors-by-founder
 Share
Share Facebook
 Twitter
 News
News