
Age structure of doctors in regions
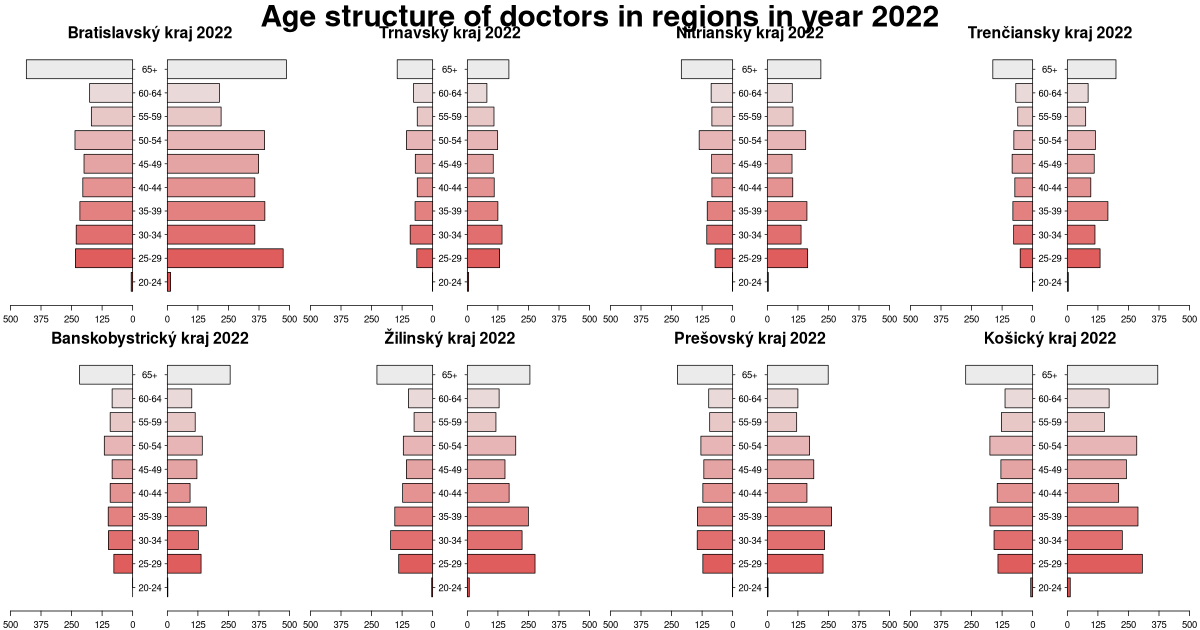
The number of doctors in age group of 40 to 60 years is very low in all regions of Slovakia.
| kraj 2024 | less than 40 years | 40 – 49y | 50 – 59y | more than 60y |
|---|---|---|---|---|
| Bratislava region | 36.6 | 20.1 | 20.9 | 22.4 |
| Trnava region | 38.7 | 17.6 | 20.4 | 23.4 |
| Nitriansky kraj | 34.8 | 19 | 20.1 | 26.1 |
| Trenčiansky kraj | 33.9 | 20.4 | 18.9 | 26.8 |
| Banská Bystrica region | 32.3 | 19.5 | 19.9 | 28.3 |
| Žilina region | 41.1 | 18.7 | 18 | 22.3 |
| Prešov region | 38.1 | 21 | 18.3 | 22.6 |
| Košice region | 36.1 | 20.1 | 21 | 22.8 |
| SR | 36.7 | 19.7 | 19.8 | 23.8 |
Suggested citation: Michal Páleník: 30 graphs on ageing - Age structure of doctors in regions, IZ Bratislava, retrieved from: https://www.iz.sk/30-graphs-on-aging/age-structure-of-doctors-in-regions, doi:10.5281/zenodo.6079128
Doctors
How does the structure and age of doctors change? How did the structure of medicine students change?. . .
Similar articles
Age structure of nurses in regions, Population density NUTS 3 – year 2024, Banská Bystrica Region, Number of health care personnel on 100 000 inhabitants in regions, NUTS3 regions of Slovakia, Number of inhabitants NUTS 3 – year 2025, Vacancies, Old-age dependency ratio NUTS 3 – year 2025, GDP per capita in PPS of EU average NUTS 3 – year 2023
 Mzdová kalkulačka
 Current statistics
 Share
Share Facebook
 Twitter
 News
News