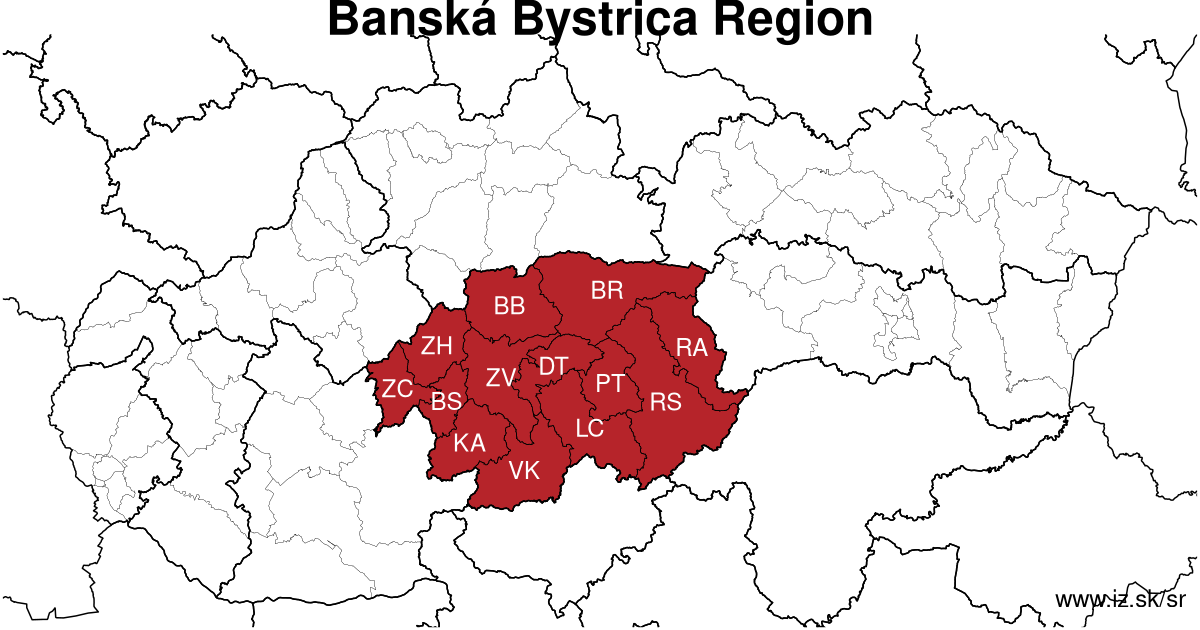
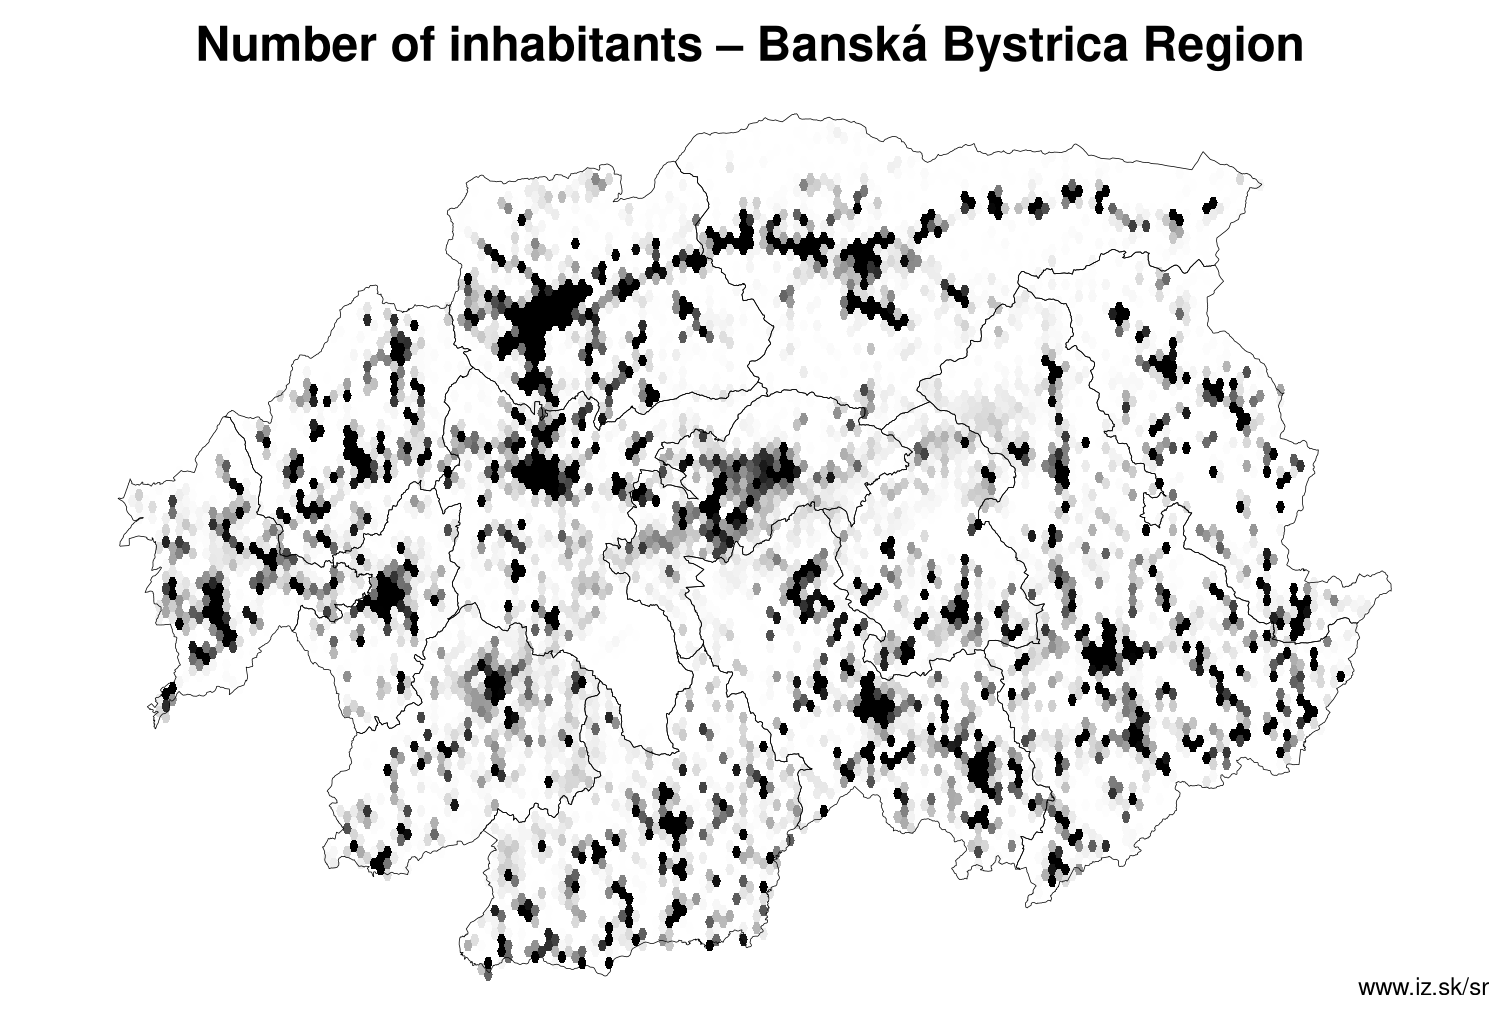
Banská Bystrica Region
consists of counties:
- Brezno
- Lučenec
- Poltár
- Rimavská Sobota
- Veľký Krtíš
- Zvolen
- Žiar nad Hronom
- Banská Bystrica
- Banská Štiavnica
- Detva
- Krupina
- Žarnovica
- Revúca
Towns
Region Banská Bystrica Region contains cities Banská Bystrica, Banská Štiavnica, Brezno, Detva, Dudince, Fiľakovo, Hnúšťa, Hriňová, Jelšava, Kremnica, Krupina, Lučenec, Modrý Kameň, Nová Baňa, Poltár, Revúca, Rimavská Sobota, Sliač, Tisovec, Tornaľa, Veľký Krtíš, Žarnovica, Žiar nad Hronom, Zvolen and 492 villages. More on oma.sk. Statistics on city level on unemployment are for the period of 2026-06-01, for population are fore yar 2025.
name | number of inhabitants in economically active age | number of unemployed number of unemployed women number of long-term unemployed | unemployment rate unemployment rate of women long-term unemployment rate |
|---|---|---|---|
 Banská Bystrica | 73 054 45 970 | 1 720 883 370 | 3.7 % 3.8 % 0.8 % |
 Zvolen | 38 747 25 197 | 886 457 227 | 3.5 % 3.6 % 0.9 % |
 Lučenec | 24 427 15 792 | 829 422 319 | 5.2 % 5.2 % 2 % |
 Rimavská Sobota | 20 964 13 647 | 957 491 466 | 7 % 7.1 % 3.4 % |
 Brezno | 19 577 12 401 | 583 344 182 | 4.7 % 5.5 % 1.5 % |
 Žiar nad Hronom | 16 433 10 602 | 434 237 137 | 4.1 % 4.5 % 1.3 % |
 Detva | 13 416 8 688 | 433 251 136 | 5 % 5.9 % 1.6 % |
 Revúca | 10 778 6 990 | 493 241 245 | 7.1 % 6.9 % 3.5 % |
 Veľký Krtíš | 10 049 6 677 | 273 151 85 | 4.1 % 4.5 % 1.3 % |
 Fiľakovo | 9 530 6 389 | 562 309 288 | 8.8 % 9.5 % 4.5 % |
 Banská Štiavnica | 9 208 6 033 | 305 152 131 | 5.1 % 5 % 2.2 % |
 Krupina | 7 496 4 869 | 192 102 56 | 3.9 % 4.2 % 1.2 % |
 Hriňová | 6 867 4 453 | 214 122 76 | 4.8 % 5.6 % 1.7 % |
 Nová Baňa | 6 799 4 323 | 212 113 77 | 4.9 % 5.2 % 1.8 % |
 Tornaľa | 6 646 4 393 | 578 312 384 | 13.2 % 14.5 % 8.7 % |
 Hnúšťa | 6 386 4 253 | 403 205 196 | 9.5 % 9.7 % 4.6 % |
 Žarnovica | 5 509 3 568 | 190 105 82 | 5.3 % 5.9 % 2.3 % |
 Poltár | 5 080 3 350 | 293 157 140 | 8.7 % 9.4 % 4.2 % |
 Sliač | 4 806 3 098 | 100 63 24 | 3.2 % 4.1 % 0.8 % |
 Kremnica | 4 586 2 875 | 97 47 35 | 3.4 % 3.4 % 1.2 % |
 Tisovec | 3 533 2 289 | 204 126 116 | 8.9 % 11.3 % 5.1 % |
 Jelšava | 3 178 2 168 | 290 164 176 | 13.4 % 16 % 8.1 % |
 Modrý Kameň | 1 634 1 081 | 93 46 29 | 8.6 % 8.9 % 2.7 % |
 Dudince | 1 377 877 | 16 9 6 | 1.8 % 2 % 0.7 % |
Villages with over 2000 inhabitants are Čierny Balog (4916), Podbrezová (3470), Valaská (3336), Slovenská Ľupča (3261), Klenovec (2952), Polomka (2859), Zvolenská Slatina (2795), Kokava nad Rimavicou (2703), Hliník nad Hronom (2640), Očová (2451), Heľpa (2393), Jesenské (2351), Pliešovce (2262), Kalinovo (2253), Rimavská Seč (2219), Badín (2152), Brusno (2122), Selce (2100), Závadka nad Hronom (2099), Pohorelá (2054), Divín (2012).
| villages by number of inhabitants | ||||||
|---|---|---|---|---|---|---|
| total | up to 300 | 300 to 500 | 500 to 1000 | 1000 to 1500 | over 1500 | |
| 492 | 189 | 96 | 120 | 49 | 38 | |
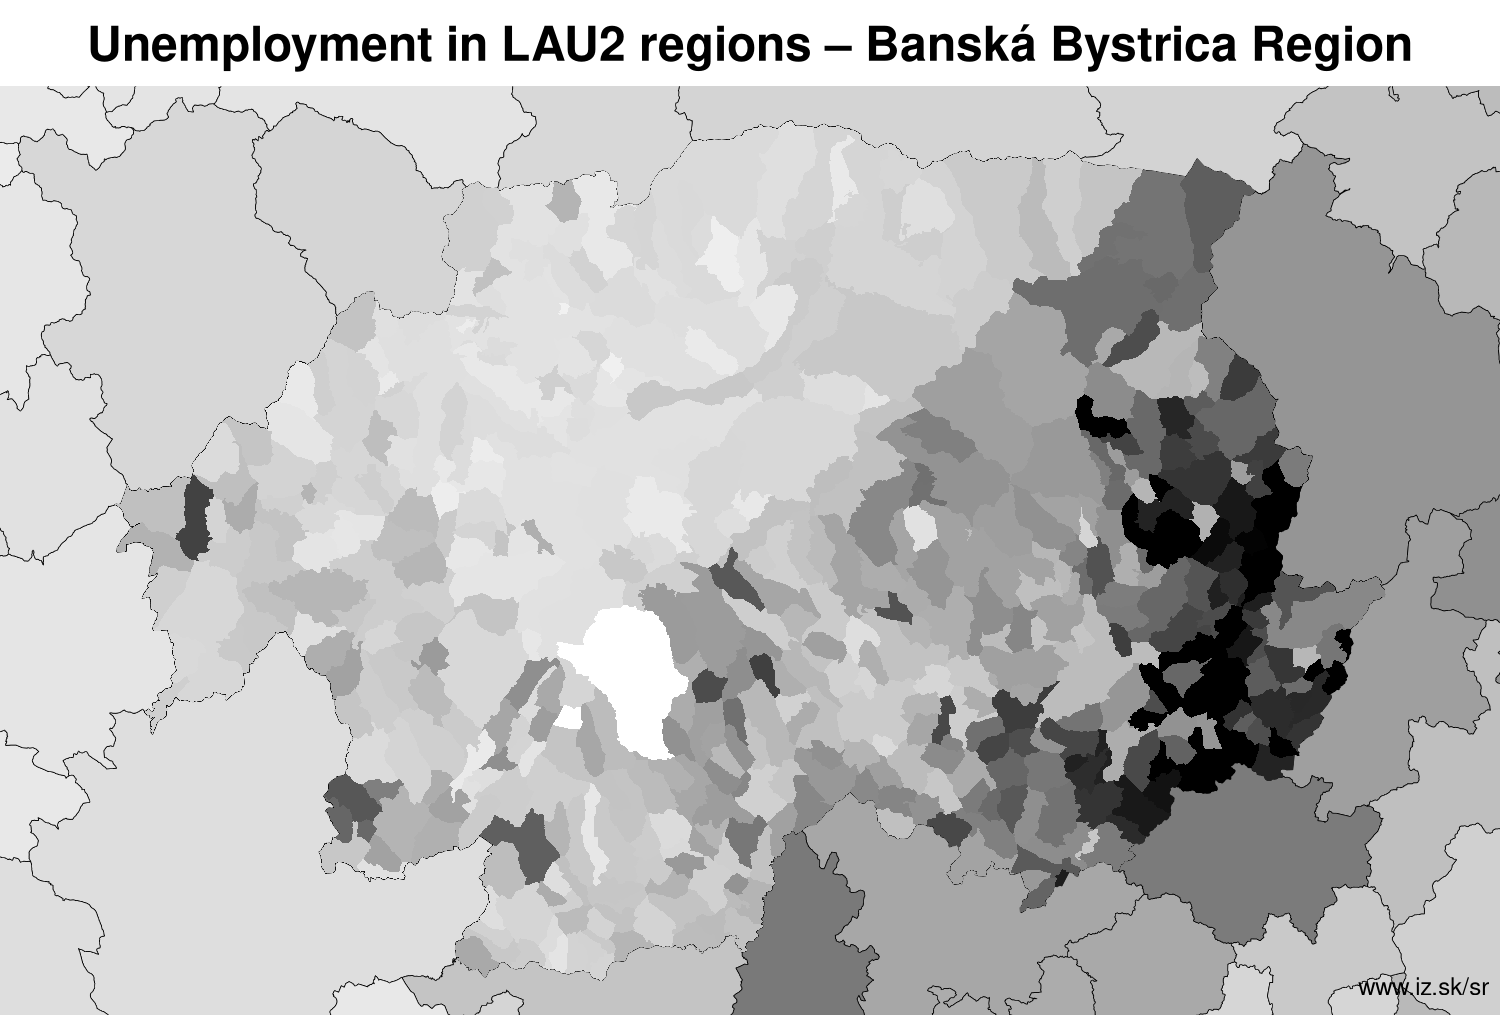
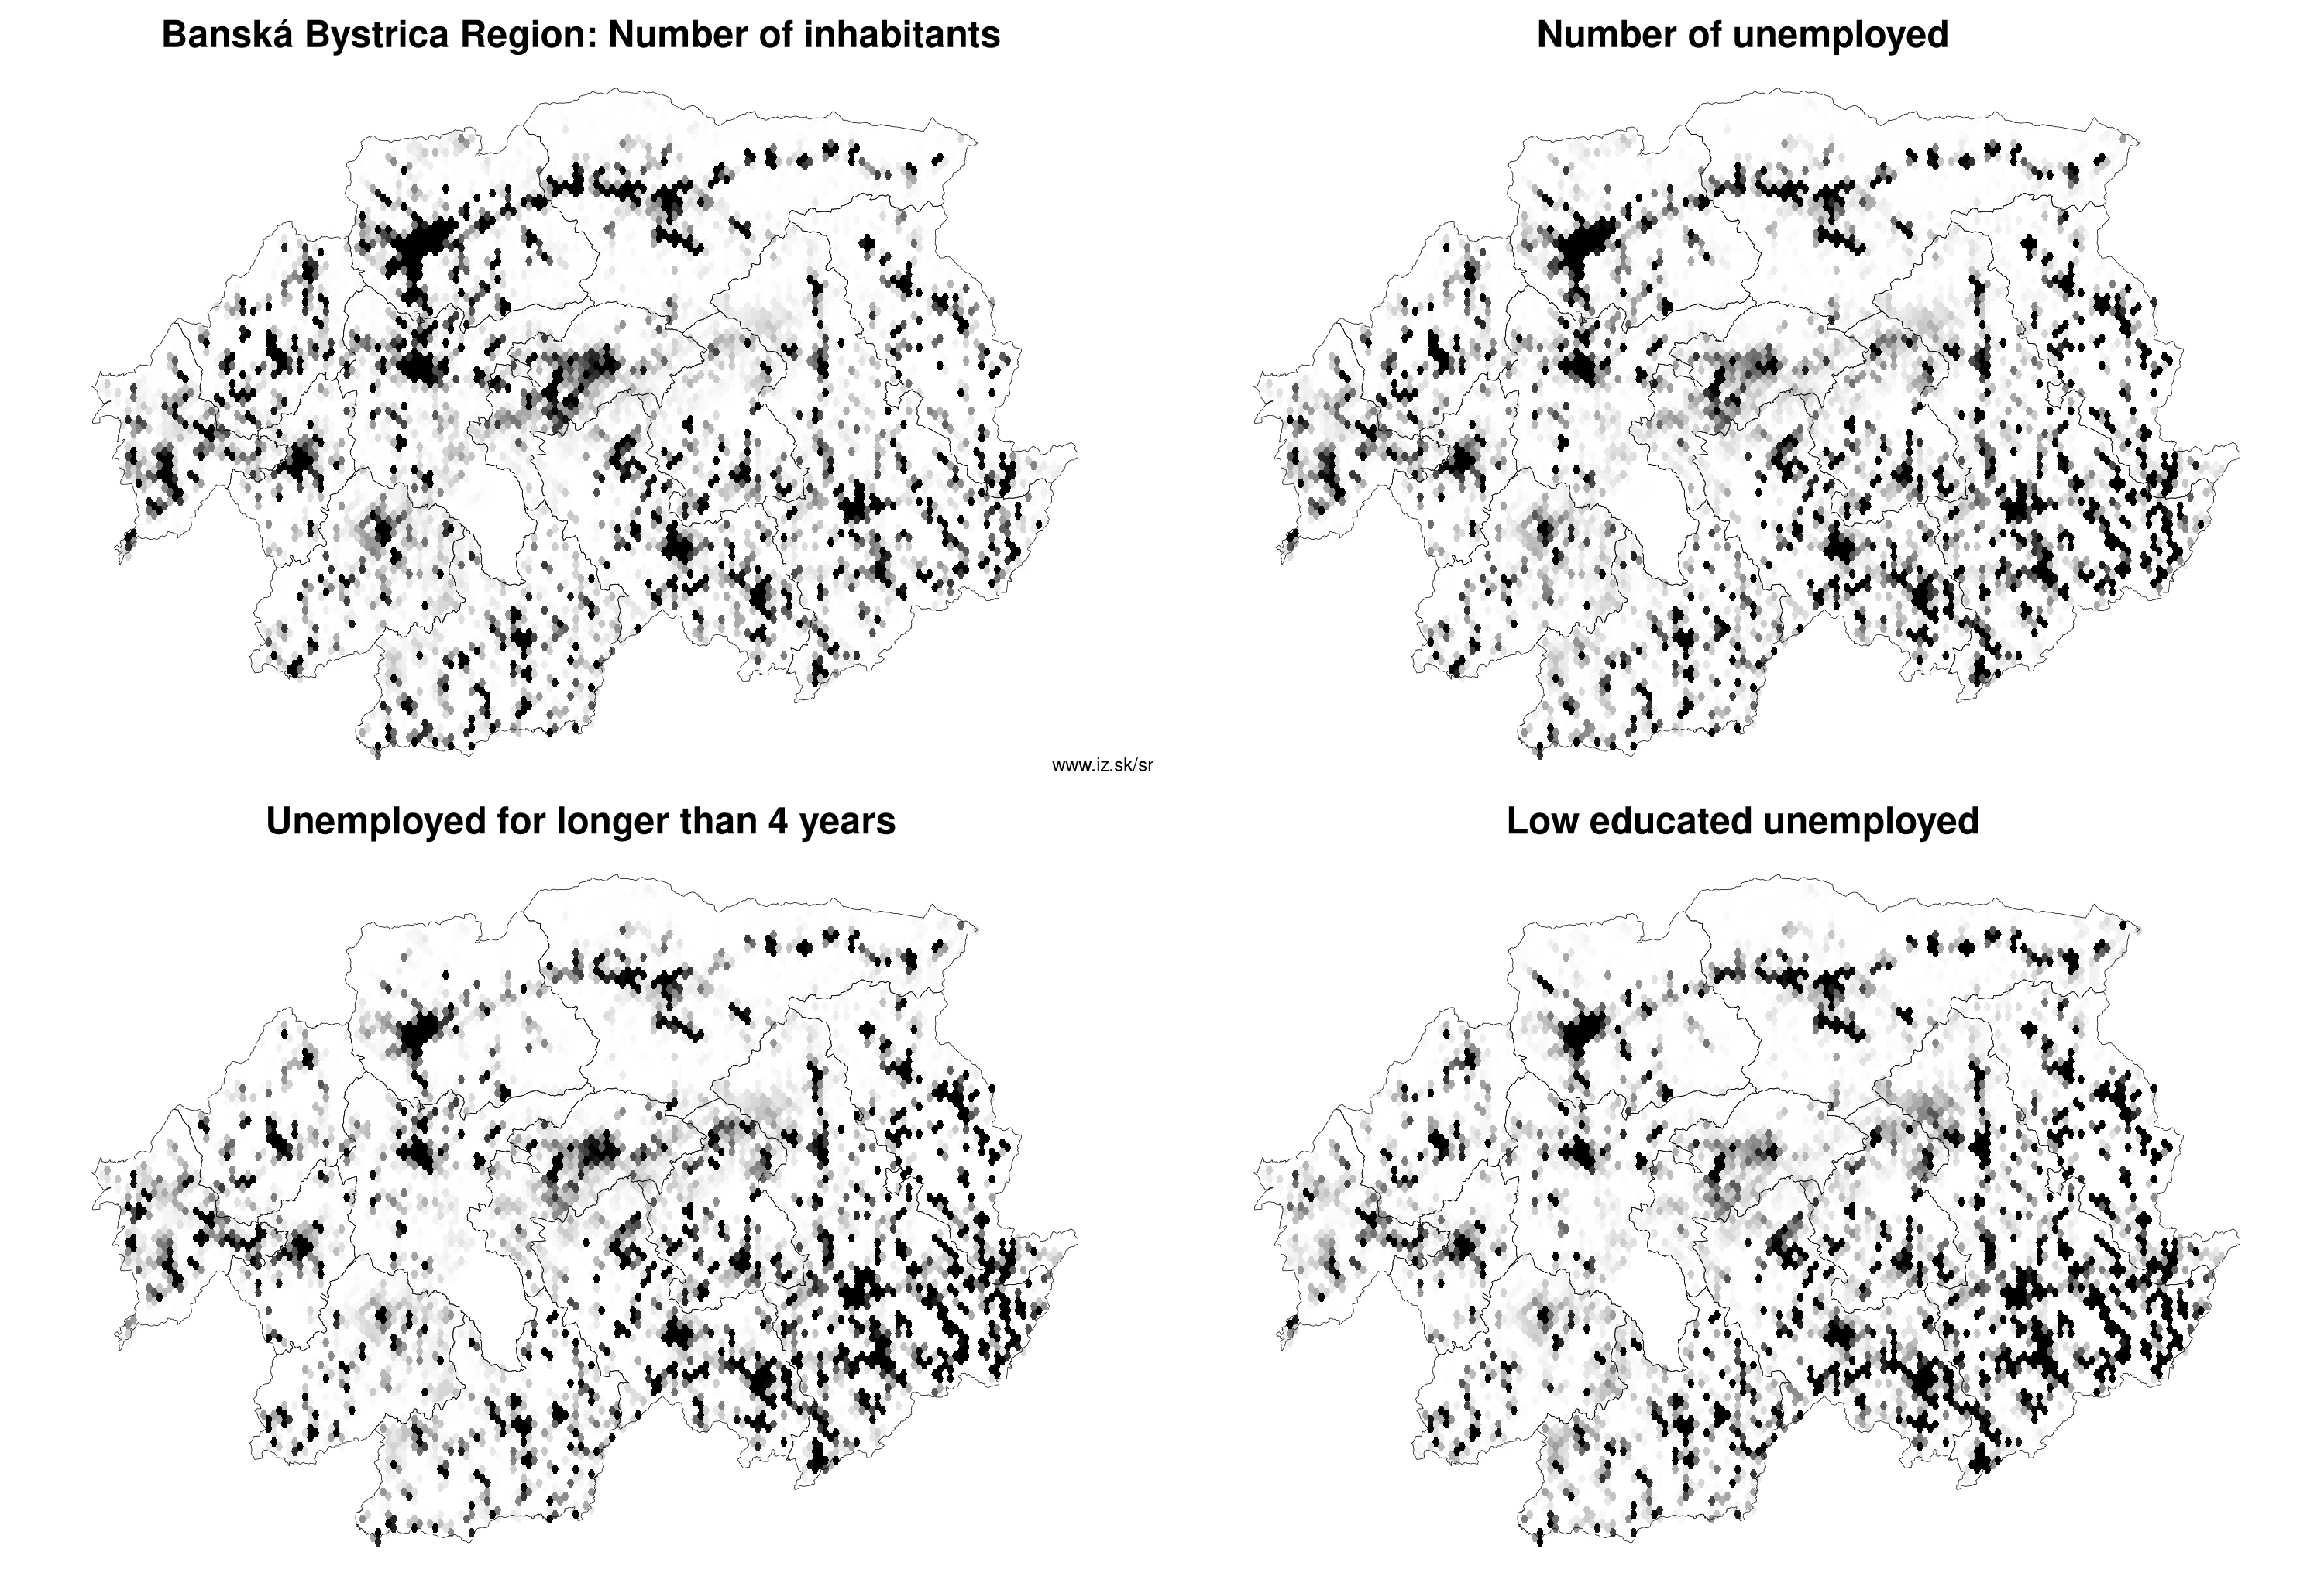
Unemployment
| rok | 2012 | 2014 | 2016 | 2018 | 2019 | 2020 | 2021 | 2022 | 2023 | 2024 | 2025 | 2026 |
|---|---|---|---|---|---|---|---|---|---|---|---|---|
| number of unemployed | 38 946 | 37 354 | 30 498 | 19 664 | 17 651 | 20 033 | 20 928 | 18 672 | 18 175 | 17 708 | 17 158 | 17 376 |
| number of long-term unemployed | 24 906 | 26 034 | 19 483 | 10 646 | 9190 | 9607 | 11 647 | 10 987 | 10 267 | 10 204 | 9869 | 9698 |
| number of people receiving social benefits | 46 914 | 44 364 | 33 941 | 25 150 | 22 730 | 22 005 | 20 362 | 20 386 | 19 848 | 19 501 | 19 130 | 19 482 |
| number of activational workers | 14 364 | 13 390 | 10 432 | 5760 | 5352 | 5369 | 4963 | 5371 | 1904 | 3300 | 3271 | 547 |
| unemployment rate | 20.6 | 20 | 16.6 | 11 | 9.9 | 11.4 | 12.4 | 11.2 | 11.1 | 10.9 | 10.6 | 10.8 |
| long-term unemployment rate | 13.2 | 13.9 | 10.6 | 5.9 | 5.2 | 5.5 | 6.9 | 6.6 | 6.3 | 6.3 | 6.1 | 6.0 |
| vacancies | 149 | 286 | 743 | 883 | 1176 | 1081 | 1013 | 1073 | 752 | 812 | 729 | 711 |
Demographics
| 2012 | 2014 | 2016 | 2018 | 2019 | 2020 | 2021 | 2022 | 2023 | 2024 | 2025 | 2026 | |
|---|---|---|---|---|---|---|---|---|---|---|---|---|
| number of inhabitants | 267 524 | 266 258 | 264 594 | 262 824 | 261 587 | 260 554 | 250 421 | 249 115 | 247 636 | 246 487 | 245 195 | 245 195 |
| assignation tax | 53 579 988 | 57 808 732 | 68 973 162 | 83 018 793 | 93 432 682 | 95 817 942 | 91 712 554 | 101 328 752 | 111 304 908 | 111 109 345 | 92 286 536 | 99 294 585 |
| demographic dependency | 20 | 21.3 | 23 | 25 | 25.9 | 26.9 | 27.2 | 28.1 | 29.2 | 30.1 | 31.1 | |
| number of employed foreigners | 89 | 364 | 603 | 898 | 994 | 806 | 1337 | 1840 | 2051 | 2077 | 1611 | 1198 |
Number of unemployed
| rok | 2012 | 2014 | 2016 | 2018 | 2019 | 2020 | 2021 | 2022 | 2023 | 2024 | 2025 | 2026 |
|---|---|---|---|---|---|---|---|---|---|---|---|---|
| less than 24 years | 8327 | 6077 | 4119 | 2147 | 1948 | 2435 | 2520 | 2176 | 2194 | 2220 | 2234 | 2401 |
| 25 to 39 years | 17 078 | 13 758 | 10 922 | 6512 | 5814 | 6687 | 6834 | 6108 | 5845 | 5628 | 5389 | 5321 |
| 40 to 54 years | 15 436 | 12 925 | 11 046 | 7304 | 6510 | 7226 | 7548 | 6760 | 6623 | 6506 | 6306 | 6467 |
| 55 years and more | 4818 | 4594 | 4411 | 3701 | 3379 | 3684 | 4026 | 3628 | 3513 | 3354 | 3229 | 3279 |
Other regions
- Basic data on Slovak regions
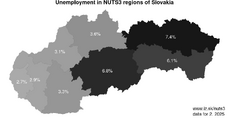
- Labour market indicators of slovak regions.
- Region Bratislava and surroundings
- Region Kopanice
- Region Danube river
- Region lower Vah river
- Region middle Vár river
- Region upper Nitra river
- Region lower Nitra river
- Region Mining cities
- Region Kysuce a Orava
- Region upper Vah river – Liptov
- Region Spiš cities
- Region upper Hron river
- Region Juhoslovenská kotlina
- Region Košice fold and Torysa river
- Region upper Zemplín
- Region lower Zemplín
Similar articles
GDP per capita in PPS of EU average NUTS 3 – year 2023, Number of inhabitants NUTS 3 – year 2025, Old-age dependency ratio NUTS 3 – year 2025, Population density NUTS 3 – year 2024, Number of health care personnel on 100 000 inhabitants in regions, Age structure of nurses in regions, Age structure of doctors in regions, NUTS3 regions of Slovakia, Vacancies
 Share
Share Facebook
 Twitter
 News
News