Age structure of doctors
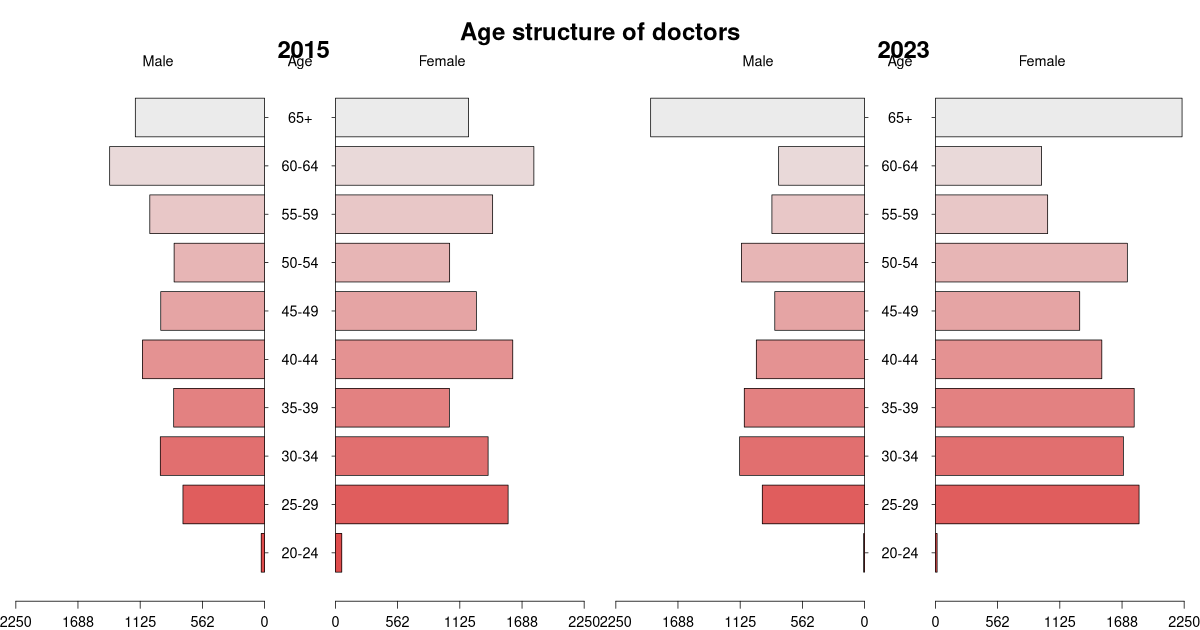
Age structure of doctors in years 2015 and 2021 according to gender.
| age | male 2015 | female 2015 | total 2015 | male 2024 | female 2024 | total 2024 | total |
|---|---|---|---|---|---|---|---|
| 20-24 | 30 | 57 | 87 | 8 | 12 | 20 | 107 |
| 25-29 | 738 | 1562 | 2300 | 991 | 1863 | 2854 | 5154 |
| 30-34 | 943 | 1381 | 2324 | 1219 | 1906 | 3125 | 5449 |
| 35-39 | 822 | 1031 | 1853 | 1096 | 1837 | 2933 | 4786 |
| 40-44 | 1104 | 1604 | 2708 | 995 | 1724 | 2719 | 5427 |
| 45-49 | 939 | 1275 | 2214 | 843 | 1242 | 2085 | 4299 |
| 50-54 | 818 | 1033 | 1851 | 1110 | 1746 | 2856 | 4707 |
| 55-59 | 1038 | 1422 | 2460 | 842 | 1134 | 1976 | 4436 |
| 60-64 | 1401 | 1795 | 3196 | 758 | 906 | 1664 | 4860 |
| 65+ | 1169 | 1204 | 2373 | 1928 | 2209 | 4137 | 6510 |
| Total | 9002 | 12 364 | 21 366 | 9790 | 14 579 | 24 369 | 45 735 |
Suggested citation: Michal Páleník: 30 graphs on ageing - Age structure of doctors, IZ Bratislava, retrieved from: https://www.iz.sk/30-graphs-on-ageing/age-structure-of-doctors, doi:10.5281/zenodo.6079128
https://www.iz.sk/30-graphs-on-ageing/age-structure-of-doctors
 Share
Share Facebook
 Twitter
 News
News