Lower Austria – AT12
EU regions: Austria > East Austria > Lower Austria
| Indicator | Period | Value |
|---|---|---|
| Life long learning | ||
| life long learning participation | 2025 | 13.7 |
| Part time jobs and flexible employment | ||
| percentage of part time workers | 2025 | 29.27 |
| percentage of part time workers, men | 2025 | 10.61 |
| percentage of part time workers, women | 2025 | 49.51 |
| Gender differences | ||
| gender gap in employment rate | 2025 | 91.91 |
| gender gap in unemployment rate | 2025 | 87.23 |
| Graduates and young people | ||
| unemployment rate of youth with elementary education | 2025 | 11.1 |
| NEET | 2025 | 8.1 |
| Gross domestic product | ||
| GDP per capita in PPS of EU average | 2024 | 98 |
| Employment | ||
| employment rate | 2025 | 75.9 |
| Social exclusion | ||
| people at risk of poverty or social exclusion | 2018 | 12.5 |
Lower Austria slovensky: AT12
Subregions: Amstetten District, Niederösterreich-Süd, St. Pölten, Waldviertel, Weinviertel, Wiener Umland/Nordteil, Wiener Umland/Südteil
Unemployment
| Indicator | Period | Value |
|---|---|---|
| Unemployment | ||
| unemployment rate | 2025 | 4.5 |
| youth unemployment rate | 2025 | 8 |
| Long term unemployment | ||
| long term unemployment | 2025 | 1 |
| share of long term unemployed | 2025 | 22 |
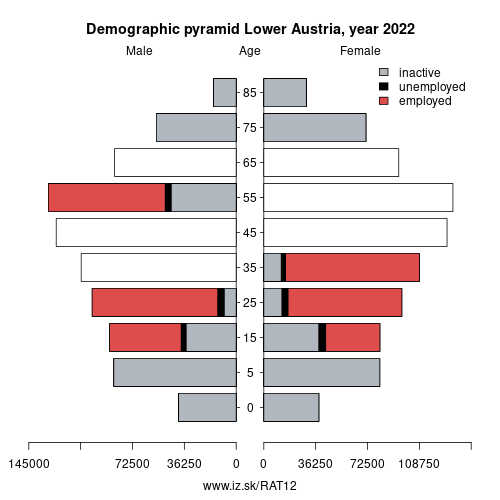
Demographics
| Indicator | Period | Value |
|---|---|---|
| Demographics | ||
| number of inhabitants | 2025 | 1 727 514 |
| population density | 2024 | 91.3 |
| old-age dependency ratio | 2025 | 33.9 |
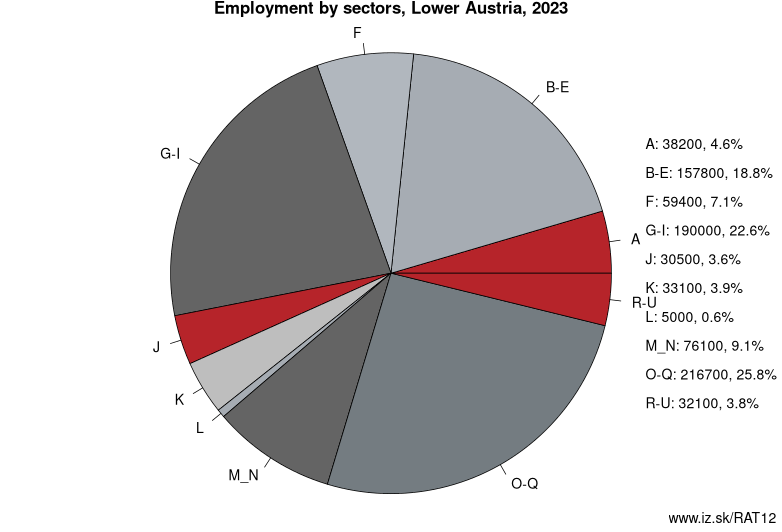
Employment by sectors, Lower Austria
| NACE r2 | % | NACE r2 | % | ||
|---|---|---|---|---|---|
| A | 40.1 | 5% | B-E | 133 | 16% |
| F | 60.7 | 7% | G-I | 195.5 | 23% |
| J | 27.8 | 3% | K | 25.5 | 3% |
| L | 8.9 | 1% | M_N | 84.5 | 10% |
| O-Q | 234.8 | 28% | R-U | 34.7 | 4% |
| TOTAL | 845.4 | 100% |
Data for the period year 2025. Source of the data is Eurostat, table [lfst_r_lfe2en2].
Other: East Austria, Wien, Burgenland, Lower Austria
Neighbours: Jihovýchod, Upper Austria, Jihozápad, Western Slovakia, Burgenland, Wien, Styria, Bratislava Region
Subregions: Amstetten District, Niederösterreich-Süd, St. Pölten, Waldviertel, Weinviertel, Wiener Umland/Nordteil, Wiener Umland/Südteil
Suggested citation: Michal Páleník: Europe and its regions in numbers - Lower Austria – AT12, IZ Bratislava, retrieved from: https://www.iz.sk/PAT12, ISBN: 978-80-970204-9-1, DOI:10.5281/zenodo.10200164
 Share
Share Facebook
 Twitter
 News
News