IZ Bratislava : Population aging : 30 graphs on ageing : Selected professions in the healthcare sector :
Selected professions in the healthcare sector
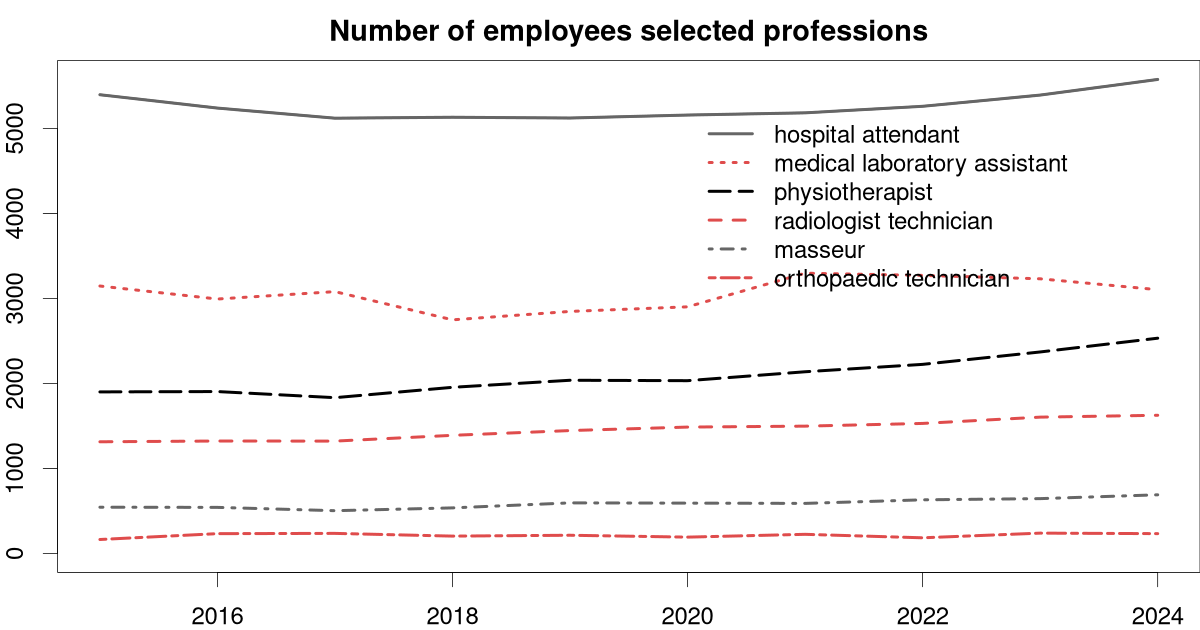
Other selected professions in the healthcare sector of Slovakia.
| rok | hospital attendant | medical laboratory assistant | physiotherapist | radiologist technician | masseur | orthopaedic technician | total |
|---|---|---|---|---|---|---|---|
| 2015 | 5398 | 3147 | 1901 | 1314 | 544 | 164 | 12 468 |
| 2016 | 5241 | 2994 | 1905 | 1323 | 542 | 233 | 12 238 |
| 2017 | 5122 | 3081 | 1833 | 1322 | 503 | 236 | 12 097 |
| 2018 | 5133 | 2749 | 1955 | 1390 | 536 | 204 | 11 967 |
| 2019 | 5124 | 2848 | 2038 | 1446 | 595 | 214 | 12 265 |
| 2020 | 5159 | 2902 | 2033 | 1487 | 592 | 192 | 12 365 |
| 2021 | 5185 | 3298 | 2138 | 1498 | 589 | 225 | 12 933 |
| 2022 | 5262 | 3272 | 2225 | 1530 | 631 | 184 | 13 104 |
| 2023 | 5394 | 3232 | 2371 | 1604 | 645 | 239 | 13 485 |
| 2024 | 5578 | 3104 | 2533 | 1626 | 690 | 233 | 13 764 |
| Mean | 5260 | 3063 | 2093 | 1454 | 587 | 212 | 12 669 |
Suggested citation: Michal Páleník: 30 graphs on ageing - Selected professions in the healthcare sector, IZ Bratislava, retrieved from: https://www.iz.sk/30-graphs-on-ageing/selected-professions, doi:10.5281/zenodo.6079128
https://www.iz.sk/30-graphs-on-ageing/selected-professions
 Share
Share Facebook
 Twitter
 News
News