- About us»
- Net income calculator»
- Population aging»
-
-
- Unemployment structure in the Visegrad region
- Development in least developed regions
- Detailed statistics of least developed regions in Slovakia
- Statistics of the least developed regions in Slovakia
-
- Average wage
- Material need benefits
- Meal allowance
- Counties of Slovakia
- Inflation
- Living and Subsistence Minimum
- Unemployment of Czechia and Slovakia
- NACE Classification
-
- Life expectancy
- Gender differences
- Youth unemployment and NEET
- Minimum wage in EU
- Unemployment rates of different age groups
- Share of salaries on GDP
- Long term unemployment
- Percentage of employees ususally working at nights
- NEET
- Unemployment rate
- Employment rate
-
- Bratislava and surroundings
- Kopanice
- Danube river
- lower Vah river
- middle Vár river
- upper Nitra river
- lower Nitra river
- Mining cities
- Kysuce a Orava
- upper Vah river - Liptov
- Spiš cities
- upper Hron river
- Juhoslovenská kotlina
- Košice fold and Torysa river
- upper Zemplín
- lower Zemplín
- EU regions
- NUTS3 regions of Slovakia
- LAU1 dataset
-
-
- Projects and activities
- Inclusive growth»
- Good work
- Project SKRS
- Social system – reality and vision
-
- Education of unemployed
- Young unemployed not taking part in education
- Proposal to change the system of education funding
- Library
- News»
- Contact
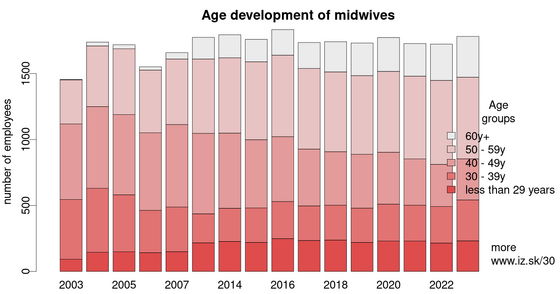
Age development of midwives

Age development of midwives in Slovakia.
| rok | less than 29 years | 30 – 39y | 40 – 49y | 50 – 59y | 60y+ | total |
|---|---|---|---|---|---|---|
| 2003 | 92 | 453 | 573 | 335 | 3 | 1456 |
| 2004 | 145 | 485 | 620 | 460 | 29 | 1739 |
| 2005 | 149 | 432 | 608 | 499 | 31 | 1719 |
| 2006 | 142 | 321 | 588 | 476 | 25 | 1552 |
| 2007 | 150 | 338 | 626 | 497 | 48 | 1659 |
| 2013 | 217 | 220 | 610 | 564 | 164 | 1775 |
| 2014 | 227 | 252 | 570 | 571 | 175 | 1795 |
| 2015 | 220 | 261 | 518 | 591 | 170 | 1760 |
| 2016 | 249 | 281 | 492 | 618 | 194 | 1834 |
| 2017 | 235 | 262 | 431 | 611 | 197 | 1736 |
| 2018 | 238 | 264 | 406 | 605 | 229 | 1742 |
| 2019 | 220 | 260 | 408 | 597 | 247 | 1732 |
| 2020 | 230 | 280 | 394 | 613 | 256 | 1773 |
| 2021 | 230 | 272 | 351 | 628 | 247 | 1728 |
| 2022 | 215 | 277 | 320 | 637 | 275 | 1724 |
| 2023 | 232 | 310 | 312 | 619 | 309 | 1782 |
| 2024 | 250 | 324 | 318 | 565 | 341 | 1798 |
| Mean | 202 | 311 | 479 | 558 | 173 | 1724 |
Suggested citation: Michal Páleník: 30 graphs on ageing - Age development of midwives, IZ Bratislava, retrieved from: https://www.iz.sk/30-graphs-on-ageing/age-development-of-midwives, doi:10.5281/zenodo.6079128
 Tento článok je súčasťou projektu Politiky zamestnanosti realizovaného Inštitútom zamestnanosti. Tento projekt je podporený z Európskeho sociálneho fondu v rámci OP EVS.
https://www.iz.sk/30-graphs-on-ageing/age-development-of-midwives


 Share
Share Facebook
 Twitter
 News
News