Employee structure
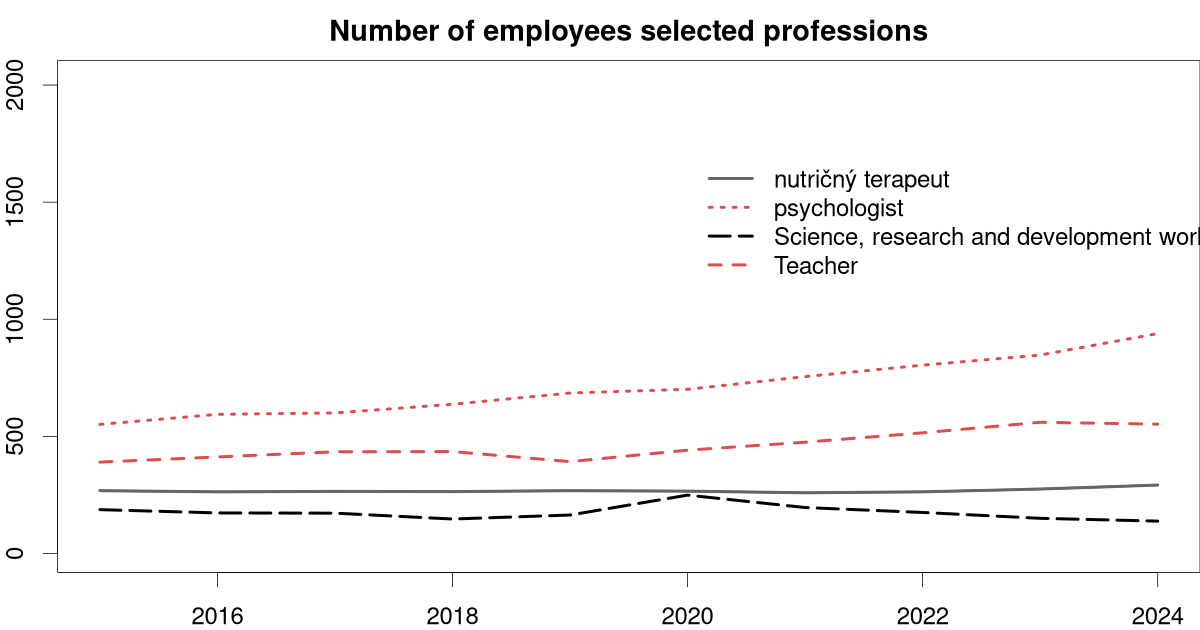
Employee structure in healthcare sector in Slovak Republic.
| rok | nutričný terapeut | psychologist | Science, research and development workforce | Teacher | total |
|---|---|---|---|---|---|
| 2015 | 268 | 551 | 187 | 390 | 1396 |
| 2016 | 263 | 594 | 173 | 412 | 1442 |
| 2017 | 265 | 600 | 172 | 434 | 1471 |
| 2018 | 264 | 637 | 147 | 435 | 1483 |
| 2019 | 268 | 685 | 164 | 392 | 1509 |
| 2020 | 266 | 701 | 249 | 441 | 1657 |
| 2021 | 259 | 755 | 196 | 475 | 1685 |
| 2022 | 263 | 804 | 175 | 515 | 1757 |
| 2023 | 275 | 847 | 150 | 560 | 1832 |
| 2024 | 292 | 939 | 138 | 552 | 1921 |
| Mean | 268 | 711 | 175 | 461 | 1615 |
Suggested citation: Michal Páleník: 30 graphs on ageing - Employee structure, IZ Bratislava, retrieved from: https://www.iz.sk/30-graphs-on-ageing/employee-structure, doi:10.5281/zenodo.6079128
https://www.iz.sk/30-graphs-on-ageing/employee-structure
 Share
Share Facebook
 Twitter
 News
News