Leicestershire, Rutland and Northamptonshire – UKF2
EU regions: United Kingdom > East Midlands > Leicestershire, Rutland and Northamptonshire
| Indicator | Period | Value |
|---|---|---|
| Life long learning | ||
| life long learning participation | 2019 | 13.7 |
| Part time jobs and flexible employment | ||
| percentage of part time workers | 2019 | 24.8 |
| percentage of part time workers, men | 2019 | 10.42 |
| percentage of part time workers, women | 2019 | 41.05 |
| Gender differences | ||
| gender gap in employment rate | 2019 | 89.99 |
| gender gap in unemployment rate | 2019 | 82.22 |
| Graduates and young people | ||
| unemployment rate of youth with elementary education | 2016 | 24.8 |
| NEET | 2019 | 9.7 |
| Employment | ||
| employment rate | 2019 | 77.8 |
Leicestershire, Rutland and Northamptonshire slovensky: UKF2
Subregions: Leicester, Leicestershire, West Northamptonshire, North Northamptonshire
Unemployment
| Indicator | Period | Value |
|---|---|---|
| Unemployment | ||
| unemployment rate | 2019 | 4.3 |
| youth unemployment rate | 2019 | 11.6 |
| Long term unemployment | ||
| long term unemployment | 2019 | 0.9 |
| share of long term unemployed | 2019 | 21.6 |
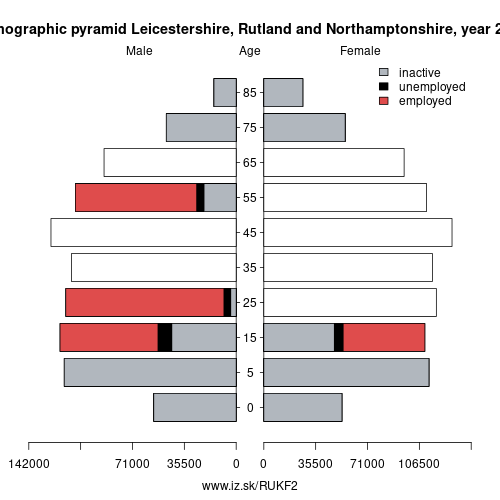
Demographics
| Indicator | Period | Value |
|---|---|---|
| Demographics | ||
| number of inhabitants | 2019 | 1 843 764 |
| population density | 2018 | 374.6 |
| old-age dependency ratio | 2019 | 28.3 |
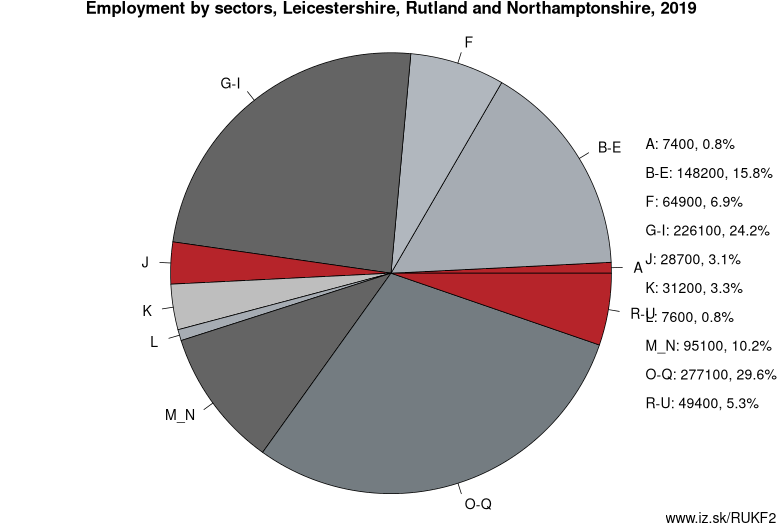
Employment by sectors, Leicestershire, Rutland and Northamptonshire
| NACE r2 | % | NACE r2 | % | ||
|---|---|---|---|---|---|
| A | 7.4 | 1% | B-E | 148.2 | 16% |
| F | 64.9 | 7% | G-I | 226.1 | 24% |
| J | 28.7 | 3% | K | 31.2 | 3% |
| L | 7.6 | 1% | M_N | 95.1 | 10% |
| O-Q | 277.1 | 30% | R-U | 49.4 | 5% |
| TOTAL | 938.9 | 100% |
Data for the period year 2019. Source of the data is Eurostat, table [lfst_r_lfe2en2].
Other: East Midlands, Derbyshire and Nottinghamshire, Lincolnshire, Leicestershire, Rutland and Northamptonshire
Neighbours: Bedfordshire and Hertfordshire, East Anglia, Herefordshire, Worcestershire and Warwickshire, Berkshire, Buckinghamshire and Oxfordshire, Derbyshire and Nottinghamshire, Shropshire and Staffordshire, Lincolnshire
Subregions: Leicester, Leicestershire, West Northamptonshire, North Northamptonshire
Suggested citation: Michal Páleník: Europe and its regions in numbers - Leicestershire, Rutland and Northamptonshire – UKF2, IZ Bratislava, retrieved from: https://www.iz.sk/PUKF2, ISBN: 978-80-970204-9-1, DOI:10.5281/zenodo.10200164
 Share
Share Facebook
 Twitter
 News
News