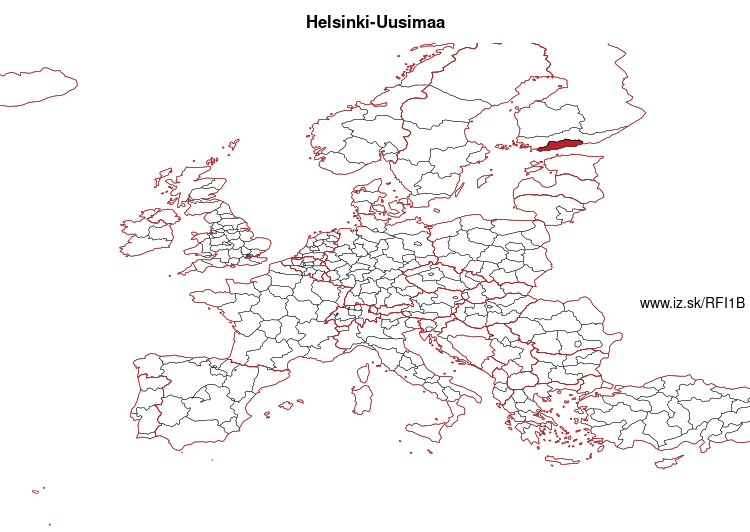
Uusimaa – FI1B
EU regions: Finland > Mainland Finland > Uusimaa
| Indicator | Period | Value |
|---|---|---|
| Life long learning | ||
| life long learning participation | 2025 | 30.8 |
| Part time jobs and flexible employment | ||
| percentage of part time workers | 2025 | 14.25 |
| percentage of part time workers, men | 2025 | 11.37 |
| percentage of part time workers, women | 2025 | 17.31 |
| Gender differences | ||
| gender gap in employment rate | 2025 | 96.87 |
| gender gap in unemployment rate | 2025 | 93.58 |
| Graduates and young people | ||
| unemployment rate of youth with elementary education | 2025 | 34.9 |
| NEET | 2025 | 8.5 |
| Gross domestic product | ||
| GDP per capita in PPS of EU average | 2024 | 128 |
| Employment | ||
| employment rate | 2025 | 72.3 |
| Social exclusion | ||
| people at risk of poverty or social exclusion | 2020 | 11.5 |
Uusimaa slovensky: FI1B
Subregions: Helsinki
Unemployment
| Indicator | Period | Value |
|---|---|---|
| Unemployment | ||
| unemployment rate | 2025 | 10.8 |
| youth unemployment rate | 2025 | 22.9 |
| Long term unemployment | ||
| long term unemployment | 2025 | 3 |
| share of long term unemployed | 2025 | 28.5 |
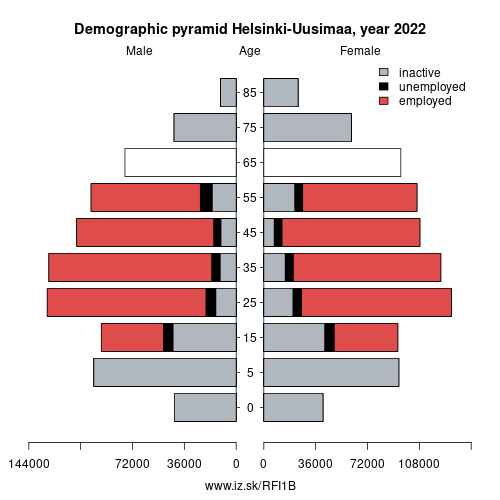
Demographics
| Indicator | Period | Value |
|---|---|---|
| Demographics | ||
| number of inhabitants | 2025 | 1 782 300 |
| population density | 2024 | 194.7 |
| old-age dependency ratio | 2025 | 27.8 |
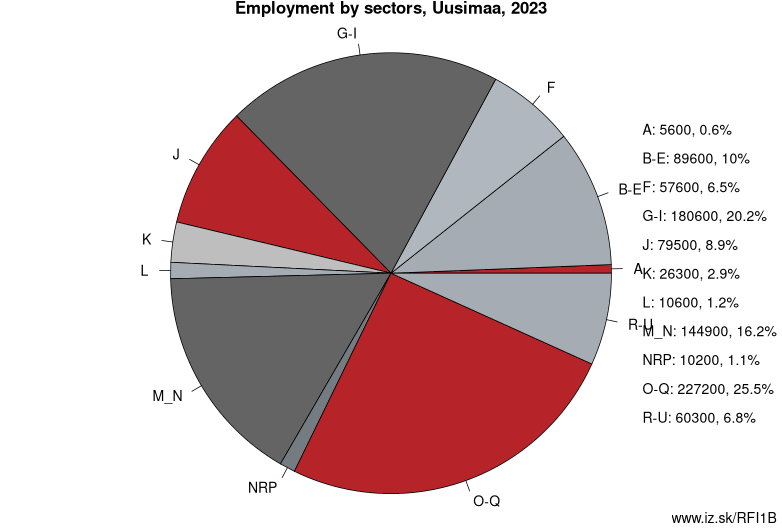
Employment by sectors, Uusimaa
| NACE r2 | % | NACE r2 | % | ||
|---|---|---|---|---|---|
| A | 7 | 1% | B-E | 86.5 | 10% |
| F | 54.7 | 6% | G-I | 192.2 | 22% |
| J | 72.8 | 8% | K | 29.4 | 3% |
| L | 10.2 | 1% | M_N | 136.8 | 15% |
| NRP | 4.8 | 1% | O-Q | 228.9 | 26% |
| R-U | 61.3 | 7% | TOTAL | 884.7 | 100% |
Data for the period year 2025. Source of the data is Eurostat, table [lfst_r_lfe2en2].
From Wikipedia :
Uusimaa (Finnish: [ˈuːsimɑː]; Swedish: Nyland, Finland Swedish: [ˈnyːlɑnd]; both lit. 'new land') is a region of Finland. It borders the regions of Southwest Finland, Tavastia Proper (Kanta-Häme), Päijänne Tavastia (Päijät-Häme), and Kymenlaakso. Finland's capital and largest city, Helsinki, along with the surrounding Greater Helsinki area, are both contained in the region, and Uusimaa is Finland's most populous region. The population of Uusimaa is 1,734,000.While predominantly Finnish-speaking, Uusimaa has the highest total number of native speakers of Swedish in Finland even at a much lower share than two other regions.
History
The place name of Nuuksio derives from the Sami word njukča which means 'swan'. Later Finns proper and Tavastians inhabited the area. Some place names have traces of Tavastian village names, like Konala, which likely derives from the older Tavastian village name Konhola. Estonians inhabited the region to a smaller extent, specifically for seasonal fishing.
Swedish colonisation of coastal Uusimaa started after the second crusade to Finland in the 13th century. The colonisation was part of converting pagan areas to Catholicism.
Other: Mainland Finland, Southern Finland, Pohjois- ja Itä-Suomi, Länsi-Suomi, Uusimaa
Neighbours: Southern Finland
Subregions: Helsinki
Suggested citation: Michal Páleník: Europe and its regions in numbers - Uusimaa – FI1B, IZ Bratislava, retrieved from: https://www.iz.sk/PFI1B, ISBN: 978-80-970204-9-1, DOI:10.5281/zenodo.10200164
 Share
Share Facebook
 Twitter
 News
News