Freiburg Government Region – DE13
EU regions: Germany > Baden-Württemberg > Freiburg Government Region
| Indicator | Period | Value |
|---|---|---|
| Life long learning | ||
| life long learning participation | 2025 | 9.6 |
| Part time jobs and flexible employment | ||
| percentage of part time workers | 2025 | 35.93 |
| percentage of part time workers, men | 2025 | 15.64 |
| percentage of part time workers, women | 2025 | 58.47 |
| Gender differences | ||
| gender gap in employment rate | 2025 | 94.27 |
| gender gap in unemployment rate | 2025 | 87.88 |
| Graduates and young people | ||
| unemployment rate of youth with elementary education | 2009 | 8.3 |
| NEET | 2025 | 7.7 |
| Gross domestic product | ||
| GDP per capita in PPS of EU average | 2024 | 105 |
| Employment | ||
| employment rate | 2025 | 79.7 |
| Social exclusion | ||
| people at risk of poverty or social exclusion | 2019 | 13.5 |
Freiburg Government Region slovensky: DE13
Subregions: Freiburg im Breisgau, Breisgau-Hochschwarzwald, Emmendingen, Ortenau, Rottweil, Schwarzwald-Baar district, Tuttlingen, Konstanz, Lörrach, Waldshut
Unemployment
| Indicator | Period | Value |
|---|---|---|
| Unemployment | ||
| unemployment rate | 2025 | 3.2 |
| youth unemployment rate | 2019 | 4 |
| Long term unemployment | ||
| long term unemployment | 2019 | 0.5 |
| share of long term unemployed | 2019 | 21 |
Demographics
| Indicator | Period | Value |
|---|---|---|
| Demographics | ||
| number of inhabitants | 2025 | 2 325 856 |
| population density | 2024 | 250.8 |
| old-age dependency ratio | 2025 | 34.8 |
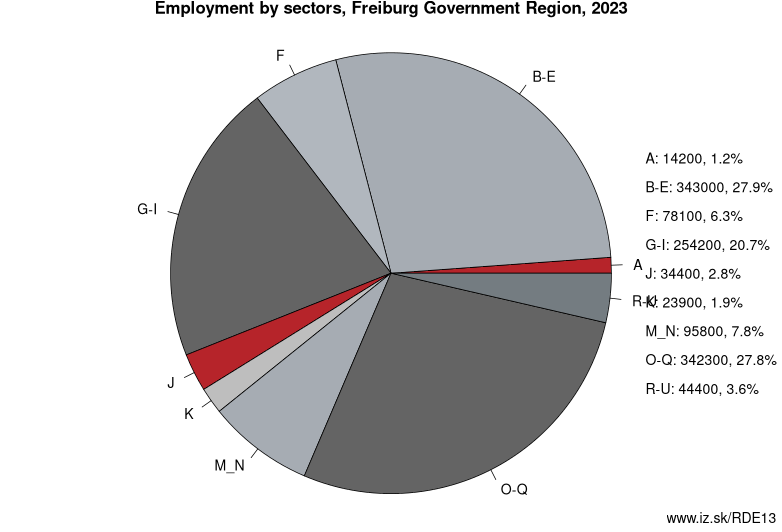
Employment by sectors, Freiburg Government Region
| NACE r2 | % | NACE r2 | % | ||
|---|---|---|---|---|---|
| B-E | 333.2 | 27% | F | 78.7 | 6% |
| G-I | 239.9 | 19% | J | 33.3 | 3% |
| K | 28.6 | 2% | M_N | 103.2 | 8% |
| O-Q | 357.2 | 29% | R-U | 52.2 | 4% |
| TOTAL | 1244.1 | 100% |
Data for the period year 2025. Source of the data is Eurostat, table [lfst_r_lfe2en2].
Other: Baden-Württemberg, Karlsruhe Government Region, Freiburg Government Region, Tübingen Government Region, Stuttgart Government Region
Neighbours: Tübingen Government Region, Vertonne, Eastern Switzerland, Canton of Zürich, Northwestern Switzerland, Karlsruhe Government Region
Subregions: Freiburg im Breisgau, Breisgau-Hochschwarzwald, Emmendingen, Ortenau, Rottweil, Schwarzwald-Baar district, Tuttlingen, Konstanz, Lörrach, Waldshut
Suggested citation: Michal Páleník: Europe and its regions in numbers - Freiburg Government Region – DE13, IZ Bratislava, retrieved from: https://www.iz.sk/PDE13, ISBN: 978-80-970204-9-1, DOI:10.5281/zenodo.10200164
 Share
Share Facebook
 Twitter
 News
News