Lower Bavaria – DE22
EU regions: Germany > Bavaria > Lower Bavaria
| Indicator | Period | Value |
|---|---|---|
| Life long learning | ||
| life long learning participation | 2025 | 6.2 |
| Part time jobs and flexible employment | ||
| percentage of part time workers | 2025 | 30.82 |
| percentage of part time workers, men | 2025 | 9.26 |
| percentage of part time workers, women | 2025 | 55.12 |
| Gender differences | ||
| gender gap in employment rate | 2025 | 94.83 |
| gender gap in unemployment rate | 2019 | 77.27 |
| Graduates and young people | ||
| unemployment rate of youth with elementary education | 2006 | 12.3 |
| NEET | 2016 | 5 |
| Gross domestic product | ||
| GDP per capita in PPS of EU average | 2024 | 113 |
| Employment | ||
| employment rate | 2025 | 81 |
| Social exclusion | ||
| people at risk of poverty or social exclusion | 2018 | 20.9 |
Lower Bavaria slovensky: DE22
Subregions: Landshut, Passau, Straubing, Deggendorf, Freyung-Grafenau, Kelheim, Landshut, Passau, Regen, Rottal-Inn, Straubing-Bogen, Dingolfing-Landau
Unemployment
| Indicator | Period | Value |
|---|---|---|
| Unemployment | ||
| unemployment rate | 2025 | 2.9 |
| youth unemployment rate | 2012 | 5.9 |
| Long term unemployment | ||
| long term unemployment | 2018 | 0.8 |
| share of long term unemployed | 2018 | 42 |
Demographics
| Indicator | Period | Value |
|---|---|---|
| Demographics | ||
| number of inhabitants | 2025 | 1 259 204 |
| population density | 2024 | 122.4 |
| old-age dependency ratio | 2025 | 35.2 |
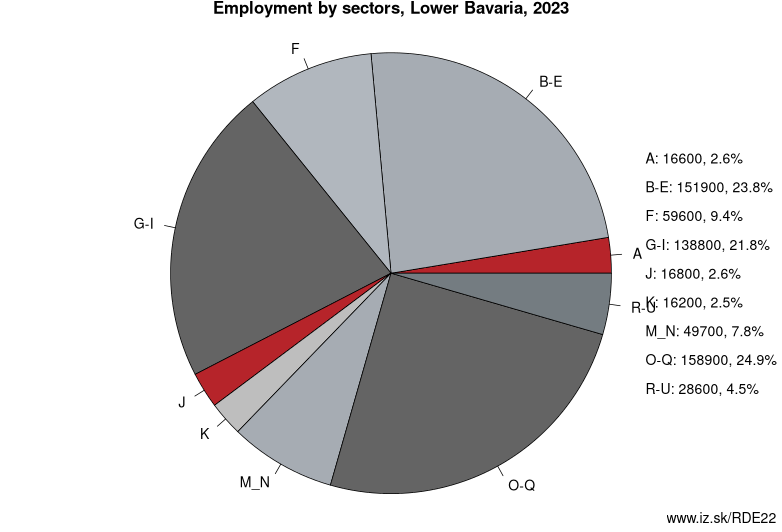
Employment by sectors, Lower Bavaria
| NACE r2 | % | NACE r2 | % | ||
|---|---|---|---|---|---|
| A | 12.1 | 2% | B-E | 194.9 | 29% |
| F | 53.3 | 8% | G-I | 132.4 | 20% |
| J | 17.3 | 3% | K | 16.8 | 2% |
| M_N | 47.7 | 7% | O-Q | 169.5 | 25% |
| R-U | 25.6 | 4% | TOTAL | 673.8 | 100% |
Data for the period year 2025. Source of the data is Eurostat, table [lfst_r_lfe2en2].
Other: Bavaria, Upper Bavaria, Upper Franconia, Lower Franconia, Lower Bavaria, Middle Franconia, Upper Palatinate, Swabia
Neighbours: Upper Austria, Upper Palatinate, Jihozápad, Upper Bavaria
Subregions: Landshut, Passau, Straubing, Deggendorf, Freyung-Grafenau, Kelheim, Landshut, Passau, Regen, Rottal-Inn, Straubing-Bogen, Dingolfing-Landau
Suggested citation: Michal Páleník: Europe and its regions in numbers - Lower Bavaria – DE22, IZ Bratislava, retrieved from: https://www.iz.sk/PDE22, ISBN: 978-80-970204-9-1, DOI:10.5281/zenodo.10200164
 Share
Share Facebook
 Twitter
 News
News