Koblenz Government Region – DEB1
EU regions: Germany > Rhineland-Palatinate > Koblenz Government Region
| Indicator | Period | Value |
|---|---|---|
| Life long learning | ||
| life long learning participation | 2025 | 8 |
| Part time jobs and flexible employment | ||
| percentage of part time workers | 2025 | 32.49 |
| percentage of part time workers, men | 2025 | 11.1 |
| percentage of part time workers, women | 2025 | 56.37 |
| Gender differences | ||
| gender gap in employment rate | 2025 | 91.43 |
| gender gap in unemployment rate | 2019 | 69.23 |
| Graduates and young people | ||
| unemployment rate of youth with elementary education | 2009 | 12.6 |
| NEET | 2025 | 8.8 |
| Gross domestic product | ||
| GDP per capita in PPS of EU average | 2024 | 95 |
| Employment | ||
| employment rate | 2025 | 79.3 |
| Social exclusion | ||
| people at risk of poverty or social exclusion | 2019 | 19.8 |
Koblenz Government Region slovensky: DEB1
Subregions: Koblenz, Ahrweiler, Altenkirchen district, Bad Kreuznach, Birkenfeld, Mayen-Koblenz, Neuwied, Rhein-Lahn-Kreis, Westerwaldkreis, Cochem-Zell, Rhein-Hunsrück-Kreis
Unemployment
| Indicator | Period | Value |
|---|---|---|
| Unemployment | ||
| unemployment rate | 2025 | 3 |
| youth unemployment rate | 2017 | 8.3 |
| Long term unemployment | ||
| long term unemployment | 2019 | 0.8 |
| share of long term unemployed | 2019 | 33.5 |
Demographics
| Indicator | Period | Value |
|---|---|---|
| Demographics | ||
| number of inhabitants | 2025 | 1 530 208 |
| population density | 2024 | 190.7 |
| old-age dependency ratio | 2025 | 38.7 |
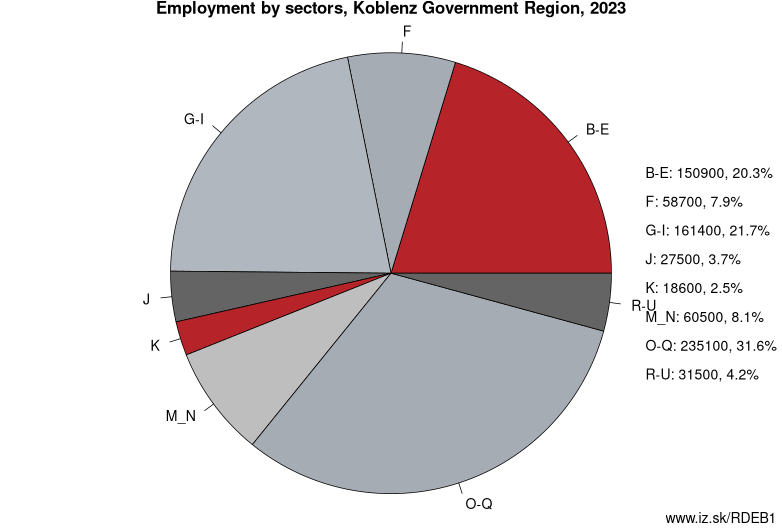
Employment by sectors, Koblenz Government Region
| NACE r2 | % | NACE r2 | % | ||
|---|---|---|---|---|---|
| B-E | 152 | 19% | F | 61.4 | 8% |
| G-I | 171.7 | 22% | J | 22.9 | 3% |
| K | 22.3 | 3% | M_N | 64.7 | 8% |
| O-Q | 239.6 | 31% | R-U | 35.2 | 4% |
| TOTAL | 784.8 | 100% |
Data for the period year 2025. Source of the data is Eurostat, table [lfst_r_lfe2en2].
Other: Rhineland-Palatinate, Rheinhessen-Pfalz, Koblenz Government Region, Trier Government Region
Neighbours: Giessen Government Region, Rheinhessen-Pfalz, Saarland, Trier Government Region, Cologne Government Region, Arnsberg Government Region, Darmstadt Government Region
Subregions: Koblenz, Ahrweiler, Altenkirchen district, Bad Kreuznach, Birkenfeld, Mayen-Koblenz, Neuwied, Rhein-Lahn-Kreis, Westerwaldkreis, Cochem-Zell, Rhein-Hunsrück-Kreis
Suggested citation: Michal Páleník: Europe and its regions in numbers - Koblenz Government Region – DEB1, IZ Bratislava, retrieved from: https://www.iz.sk/PDEB1, ISBN: 978-80-970204-9-1, DOI:10.5281/zenodo.10200164
 Share
Share Facebook
 Twitter
 News
News