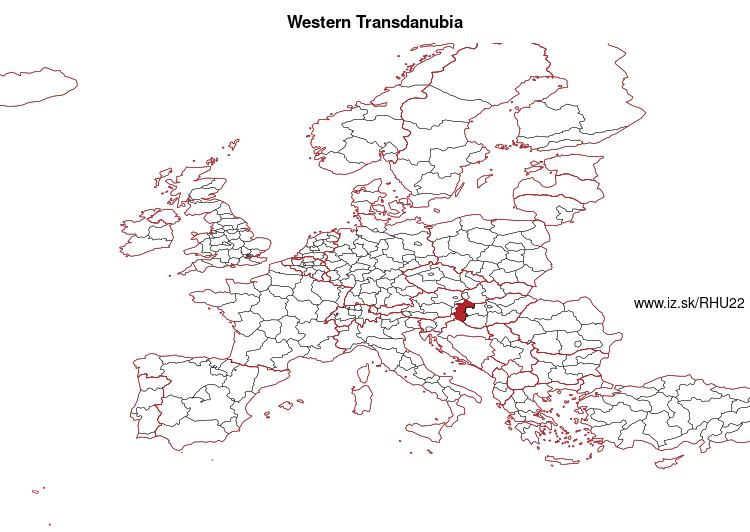
Western Transdanubia – HU22
EU regions: Hungary > Transdanubia > Western Transdanubia
| Indicator | Period | Value |
|---|---|---|
| Life long learning | ||
| life long learning participation | 2025 | 7.3 |
| Part time jobs and flexible employment | ||
| percentage of part time workers | 2025 | 7.56 |
| percentage of part time workers, men | 2025 | 3.59 |
| percentage of part time workers, women | 2025 | 12.04 |
| Gender differences | ||
| gender gap in employment rate | 2025 | 90.39 |
| gender gap in unemployment rate | 2025 | 96.77 |
| Graduates and young people | ||
| NEET | 2025 | 5.5 |
| Gross domestic product | ||
| GDP per capita in PPS of EU average | 2024 | 66 |
| Employment | ||
| employment rate | 2025 | 76.3 |
| Social exclusion | ||
| people at risk of poverty or social exclusion | 2020 | 15.2 |
Western Transdanubia slovensky: HU22
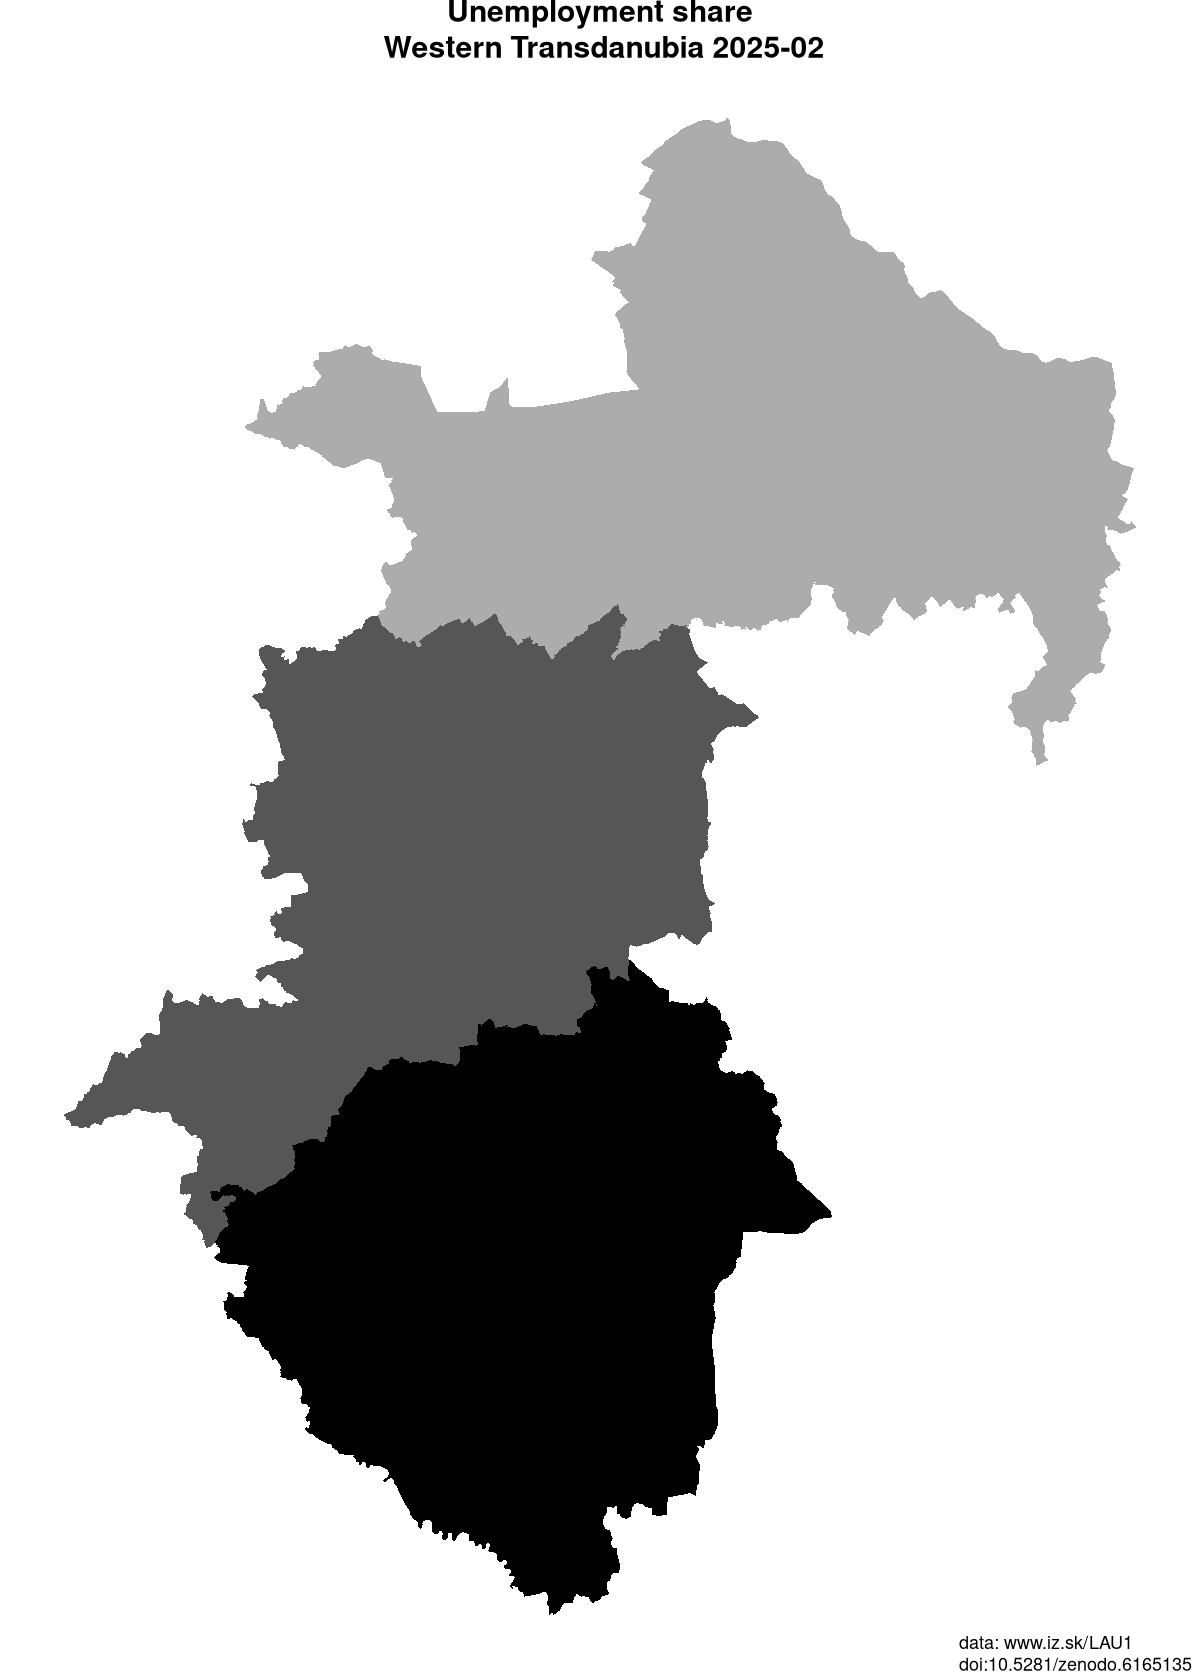
Subregions: Győr-Moson-Sopron County, Vas County, Zala County
Unemployment
| Indicator | Period | Value |
|---|---|---|
| Unemployment | ||
| unemployment rate | 2025 | 3.1 |
| youth unemployment rate | 2024 | 11.6 |
| Long term unemployment | ||
| long term unemployment | 2025 | 0.6 |
| share of long term unemployed | 2025 | 20 |
| Unemployment according to labour offices | ||
| number of registered unemployed | April 2026 | 13 643 |
| number of unemployed women | April 2026 | 6591 |
| number of vacancies | April 2026 | 8532 |
Comparison of unemployment according to ILO methodology and registered unemployment yields some differences.
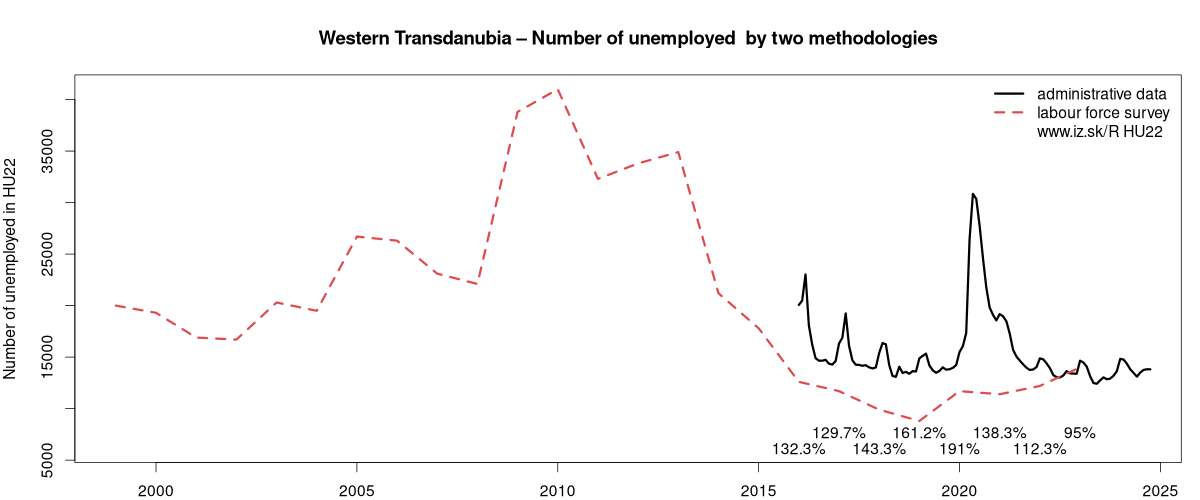
Data on unemployment in counties of Western Transdanubia are available at Local Administrative Units data of Visegrad countries.
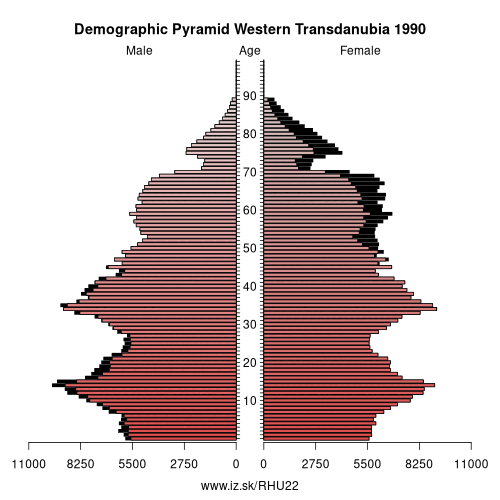
Demographics
| Indicator | Period | Value |
|---|---|---|
| Demographics | ||
| number of inhabitants | 2025 | 974 617 |
| population density | 2024 | 87.4 |
| old-age dependency ratio | 2025 | 33.4 |
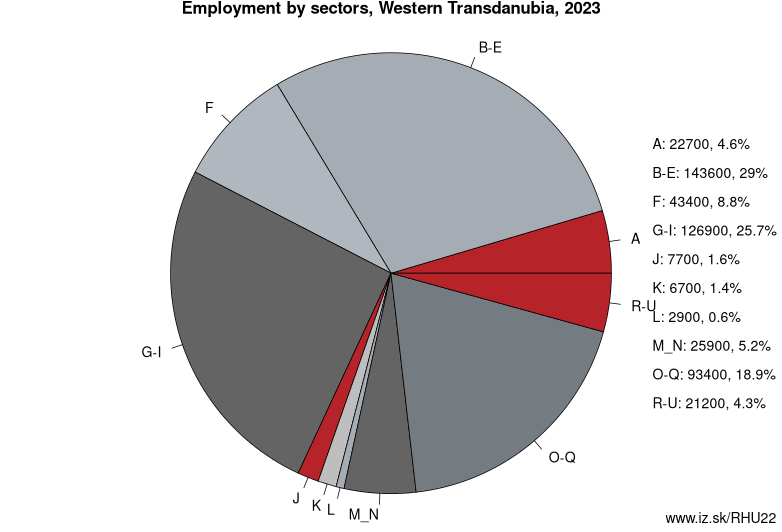
Employment by sectors, Western Transdanubia
| NACE r2 | % | NACE r2 | % | ||
|---|---|---|---|---|---|
| A | 21.9 | 5% | B-E | 125.7 | 26% |
| F | 40.7 | 8% | G-I | 123.4 | 26% |
| J | 8.5 | 2% | K | 9.5 | 2% |
| L | 3.7 | 1% | M_N | 29.2 | 6% |
| O-Q | 95.8 | 20% | R-U | 22.2 | 5% |
| TOTAL | 480.6 | 100% |
Data for the period year 2025. Source of the data is Eurostat, table [lfst_r_lfe2en2].
Other: Transdanubia, Southern Transdanubia, Central Transdanubia, Western Transdanubia
Neighbours: Southern Transdanubia, Eastern Slovenia, Central Transdanubia, Bratislava Region, Western Slovakia, Kontinentalna Hrvatska, Burgenland
Subregions: Győr-Moson-Sopron County, Vas County, Zala County
Suggested citation: Michal Páleník: Europe and its regions in numbers - Western Transdanubia – HU22, IZ Bratislava, retrieved from: https://www.iz.sk/PHU22, ISBN: 978-80-970204-9-1, DOI:10.5281/zenodo.10200164
Local Administrative Units data of Visegrad countries
Statistical data on LAU1 regions of Slovakia, Czechia, Poland, Hungary. This LAU1 panel data dataset on 556 regions contains data on population, age structure of inhabitants, on number and structure of unemployed and is regularly updated.. . .
Similar articles
Regions of the European Union, Regions of the Slovak Republic, Changes in the LAU1 dataset, Vacancies, Unemployment structure in the Visegrad region, Local Administrative Units data of Visegrad countries, Labour market indicators of slovak regions., Counties of Slovakia, Unemployment of Czechia and Slovakia
 Share
Share Facebook
 Twitter
 News
News