ALMP expenditures vs. unemployment
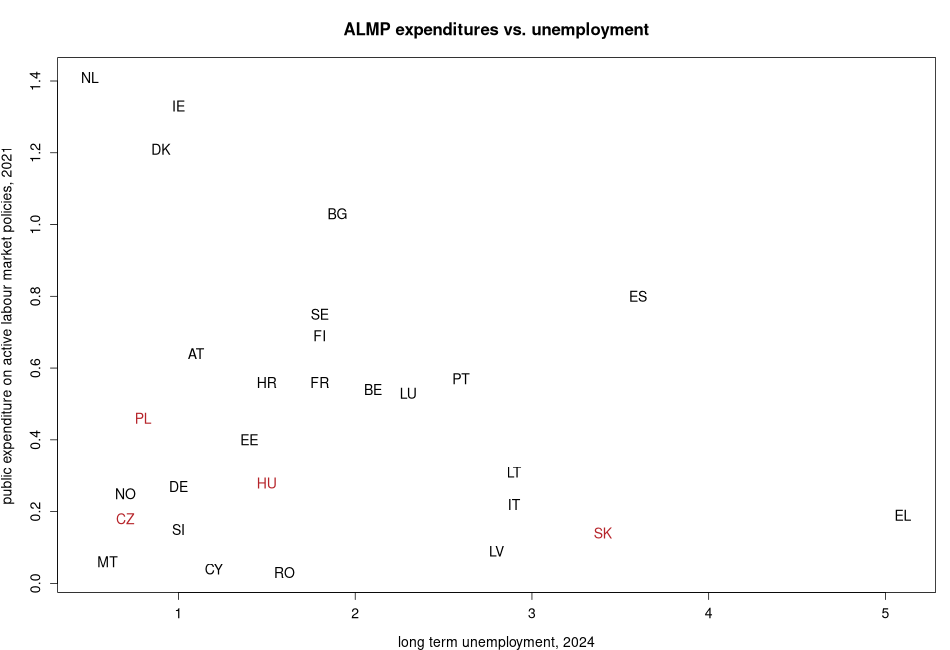
| code | public expenditure on active labour market policies, 2023 | long term unemployment, 2026 | public expenditure on labour market policies as % of GDP, 2023 | unemployment rate, 2026 | |
|---|---|---|---|---|---|
| AT | Austria | 0.63 | 1.3 | 2.05 | 6.4 |
| BE | Belgium | 0.47 | 2.3 | 1.56 | 6.3 |
| BG | Bulgaria | 0.06 | 1.4 | 0.38 | 3.2 |
| CH | Switzerland | 1.7 | 5.4 | ||
| CY | Cyprus | 0.03 | 0.8 | 0.39 | 4.1 |
| CZ | Czech Republic | 0.16 | 1 | 0.4 | 3.2 |
| DE | Germany | 0.24 | 1.1 | 1.42 | 4.1 |
| DK | Denmark | 1.12 | 1 | 2.15 | 7.5 |
| EE | Estonia | 0.26 | 1.7 | 1.11 | 7.3 |
| EL | Greece | 0.33 | 5.2 | 0.93 | 10.8 |
| ES | Spain | 0.55 | 3.3 | 2.38 | 10.9 |
| FI | Finland | 0.71 | 3.2 | 2 | 10.9 |
| FR | France | 0.55 | 2 | 2.49 | 8.3 |
| HR | Croatia | 0.56 | 1.6 | 1.93 | 5.6 |
| HU | Hungary | 0.17 | 1.7 | 0.42 | 4.7 |
| IE | Ireland | 0.16 | 1.4 | 0.61 | 5 |
| IS | Iceland | 1 | 5.5 | ||
| IT | Italy | 0.48 | 2.5 | 1.56 | 5.5 |
| LT | Lithuania | 0.2 | 2.5 | 0.86 | 7.7 |
| LU | Luxembourg | 0.52 | 2.1 | 1.27 | 7.2 |
| LV | Latvia | 0.09 | 2.9 | 0.52 | 7.4 |
| ME | Montenegro | 16.3 | 21.5 | ||
| MK | North Macedonia | 7.3 | 11.5 | ||
| MT | Malta | 0.04 | 0.7 | 0.43 | 3.5 |
| NL | Netherlands | 0.37 | 0.6 | 1.34 | 4.2 |
| NO | Norway | 0.2 | 0.7 | 0.58 | 5 |
| PL | Poland | 0.21 | 1 | 0.36 | 3.3 |
| PT | Portugal | 0.34 | 2.2 | 1.1 | 6.3 |
| RO | Romania | 0.03 | 2.1 | 0.1 | 6.5 |
| RS | Serbia | 3.4 | 9.2 | ||
| SE | Sweden | 0.58 | 2.2 | 1.28 | 9.2 |
| SI | Slovenia | 0.06 | 1.2 | 0.36 | 4.2 |
| SK | Slovakia | 0.09 | 3.9 | 0.7 | 6 |
| TR | Turkey | 1.6 | 8.8 | ||
| UK | United Kingdom | 0.03 | 0.53 | 5 |
More on the compared variables:
- public expenditure on active labour market policies, 2023
- long term unemployment, 2026
- public expenditure on labour market policies as % of GDP, 2023
- unemployment rate, 2026
Suggested citation: Michal Páleník: Europe and its regions in numbers - ALMP expenditures vs. unemployment, IZ Bratislava, retrieved from: https://www.iz.sk/en/projects/EU-indicators/almp-vs-unemployment, ISBN: 978-80-970204-9-1, DOI:10.5281/zenodo.10200164
https://www.iz.sk/en/projects/EU-indicators/almp-vs-unemployment
 Share
Share Facebook
 Twitter
 News
News