Vacancies and unemployment
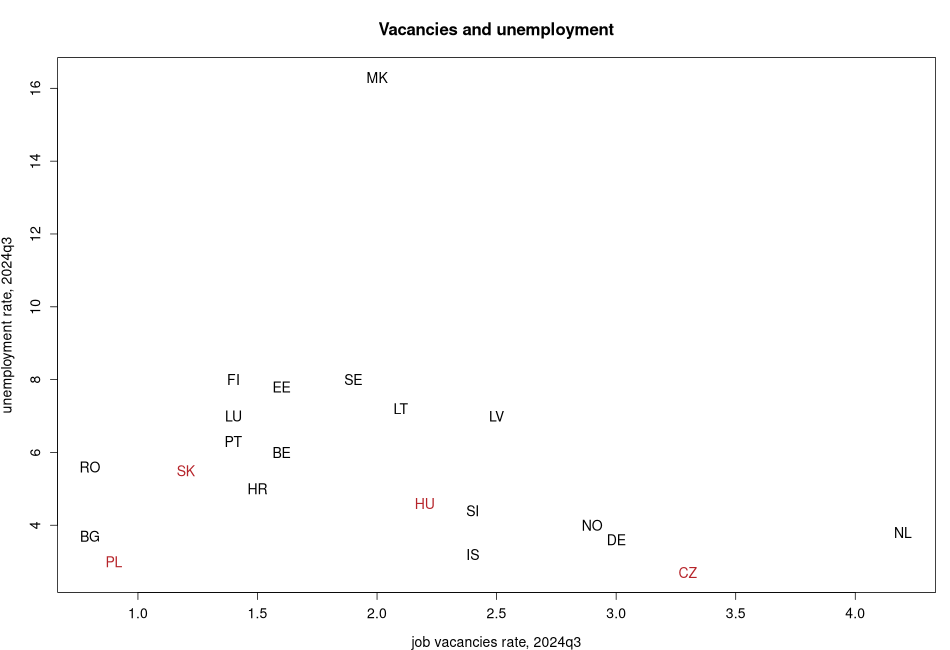
| code | unemployment rate, 2026 | job vacancies rate, | long term unemployment, 2026 | |
|---|---|---|---|---|
| AT | Austria | 6.4 | 1.3 | |
| BE | Belgium | 6.3 | 2.3 | |
| BG | Bulgaria | 3.2 | 1.4 | |
| CH | Switzerland | 5.4 | 1.7 | |
| CY | Cyprus | 4.1 | 0.8 | |
| CZ | Czech Republic | 3.2 | 1 | |
| DE | Germany | 4.1 | 1.1 | |
| DK | Denmark | 7.5 | 1 | |
| EE | Estonia | 7.3 | 1.7 | |
| EL | Greece | 10.8 | 5.2 | |
| ES | Spain | 10.9 | 3.3 | |
| FI | Finland | 10.9 | 3.2 | |
| FR | France | 8.3 | 2 | |
| HR | Croatia | 5.6 | 1.6 | |
| HU | Hungary | 4.7 | 1.7 | |
| IE | Ireland | 5 | 1.4 | |
| IS | Iceland | 5.5 | 1 | |
| IT | Italy | 5.5 | 2.5 | |
| LT | Lithuania | 7.7 | 2.5 | |
| LU | Luxembourg | 7.2 | 2.1 | |
| LV | Latvia | 7.4 | 2.9 | |
| ME | Montenegro | 21.5 | 16.3 | |
| MK | North Macedonia | 11.5 | 7.3 | |
| MT | Malta | 3.5 | 0.7 | |
| NL | Netherlands | 4.2 | 0.6 | |
| NO | Norway | 5 | 0.7 | |
| PL | Poland | 3.3 | 1 | |
| PT | Portugal | 6.3 | 2.2 | |
| RO | Romania | 6.5 | 2.1 | |
| RS | Serbia | 9.2 | 3.4 | |
| SE | Sweden | 9.2 | 2.2 | |
| SI | Slovenia | 4.2 | 1.2 | |
| SK | Slovakia | 6 | 3.9 | |
| TR | Turkey | 8.8 | 1.6 |
More on the compared variables:
- unemployment rate, 2026
- job vacancies rate,
- long term unemployment, 2026
Suggested citation: Michal Páleník: Europe and its regions in numbers - Vacancies and unemployment, IZ Bratislava, retrieved from: https://www.iz.sk/en/projects/EU-indicators/beveridge, ISBN: 978-80-970204-9-1, DOI:10.5281/zenodo.10200164
https://www.iz.sk/en/projects/EU-indicators/beveridge
 Share
Share Facebook
 Twitter
 News
News