Unemployment rates by duration
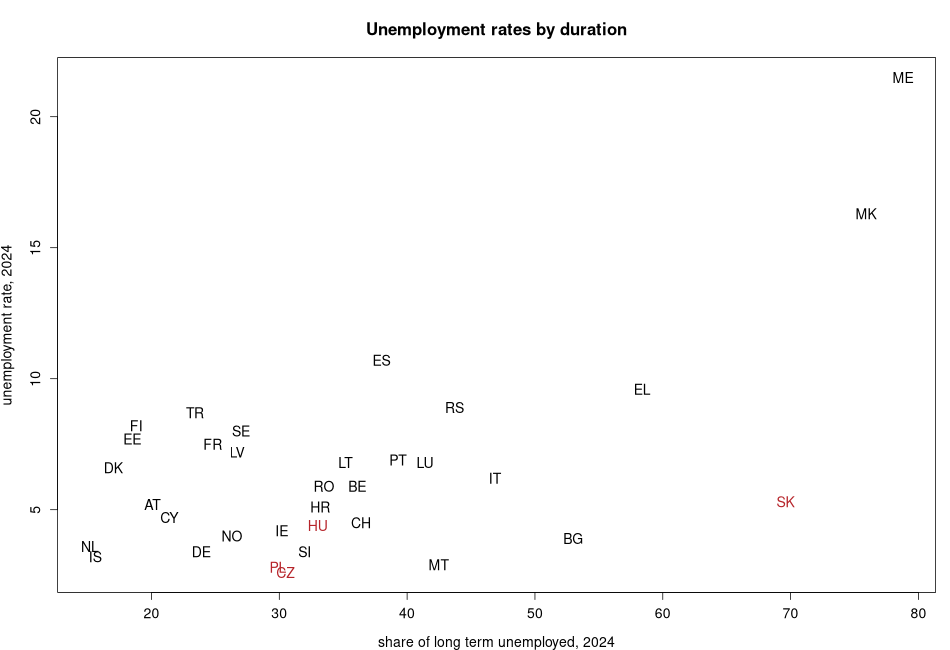
| code | unemployment rate, 2026 | share of long term unemployed, 2026 | long term unemployment, 2026 | |
|---|---|---|---|---|
| AT | Austria | 6.4 | 21.9 | 1.3 |
| BE | Belgium | 6.3 | 42.2 | 2.3 |
| BG | Bulgaria | 3.2 | 45.4 | 1.4 |
| CH | Switzerland | 5.4 | 30.8 | 1.7 |
| CY | Cyprus | 4.1 | 15.3 | 0.8 |
| CZ | Czech Republic | 3.2 | 29.4 | 1 |
| DE | Germany | 4.1 | 27.1 | 1.1 |
| DK | Denmark | 7.5 | 12.6 | 1 |
| EE | Estonia | 7.3 | 27.2 | 1.7 |
| EL | Greece | 10.8 | 52.3 | 5.2 |
| ES | Spain | 10.9 | 33.1 | 3.3 |
| FI | Finland | 10.9 | 23.4 | 3.2 |
| FR | France | 8.3 | 23.4 | 2 |
| HR | Croatia | 5.6 | 31.3 | 1.6 |
| HU | Hungary | 4.7 | 34.7 | 1.7 |
| IE | Ireland | 5 | 29.8 | 1.4 |
| IS | Iceland | 5.5 | 24.5 | 1 |
| IT | Italy | 5.5 | 47.6 | 2.5 |
| LT | Lithuania | 7.7 | 30.9 | 2.5 |
| LU | Luxembourg | 7.2 | 41.9 | 2.1 |
| LV | Latvia | 7.4 | 36.5 | 2.9 |
| ME | Montenegro | 21.5 | 78.8 | 16.3 |
| MK | North Macedonia | 11.5 | 67.9 | 7.3 |
| MT | Malta | 3.5 | 42.5 | 0.7 |
| NL | Netherlands | 4.2 | 13.1 | 0.6 |
| NO | Norway | 5 | 16.3 | 0.7 |
| PL | Poland | 3.3 | 30.6 | 1 |
| PT | Portugal | 6.3 | 34.6 | 2.2 |
| RO | Romania | 6.5 | 38.5 | 2.1 |
| RS | Serbia | 9.2 | 37 | 3.4 |
| SE | Sweden | 9.2 | 30.6 | 2.2 |
| SI | Slovenia | 4.2 | 32.2 | 1.2 |
| SK | Slovakia | 6 | 64.1 | 3.9 |
| TR | Turkey | 8.8 | 25.2 | 1.6 |
More on the compared variables:
- unemployment rate, 2026
- share of long term unemployed, 2026
- long term unemployment, 2026
Suggested citation: Michal Páleník: Europe and its regions in numbers - Unemployment rates by duration, IZ Bratislava, retrieved from: https://www.iz.sk/en/projects/EU-indicators/unemployment-rates-by-duration, ISBN: 978-80-970204-9-1, DOI:10.5281/zenodo.10200164
https://www.iz.sk/en/projects/EU-indicators/unemployment-rates-by-duration
Similar articles
Basic indicators, Youth unemployment rate NUTS 2 – year 2025, Unemployment rate NUTS 2 – year 2025, Unemployment rate of low educated people – 1 quarter 2026, Unemployment rates of different age groups, Unemployment rates by duration NUTS 2, Gender differences, Life expectancy, Vacancies and unemployment
 Share
Share Facebook
 Twitter
 News
News