Malta – MT0
EU regions: Malta > Malta
| Indicator | Period | Value |
|---|---|---|
| Life long learning | ||
| life long learning participation | 2022 | 12.8 |
| Part time jobs and flexible employment | ||
| percentage of part time workers | 2022 | 10.63 |
| percentage of part time workers, men | 2022 | 5.52 |
| percentage of part time workers, women | 2022 | 18.03 |
| Gender differences | ||
| gender gap in employment rate | 2022 | 84.59 |
| gender gap in unemployment rate | 2022 | 83.78 |
| Graduates and young people | ||
| unemployment rate of youth with elementary education | 2022 | 21.3 |
| NEET | 2022 | 7.1 |
| Gross domestic product | ||
| GDP per capita in PPS of EU average | 2022 | 104 |
| Employment | ||
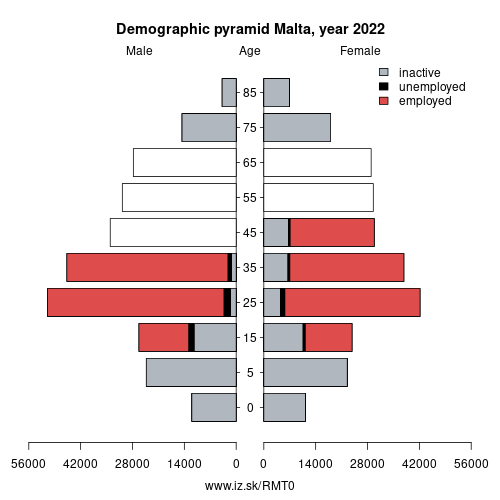
| employment rate | 2022 | 76.5 |
More on wikipedia wikidata Q233 on OpenStreetMap Malta slovensky: MT0
Subregions: Malta, Malta, Gozo and Comino/Għawdex u Kemmuna
Unemployment
| Indicator | Period | Value |
|---|---|---|
| Unemployment | ||
| unemployment rate | 2022 | 3.5 |
| youth unemployment rate | 2022 | 9 |
| Long term unemployment | ||
| long term unemployment | 2022 | 1.2 |
| share of long term unemployed | 2022 | 34.2 |
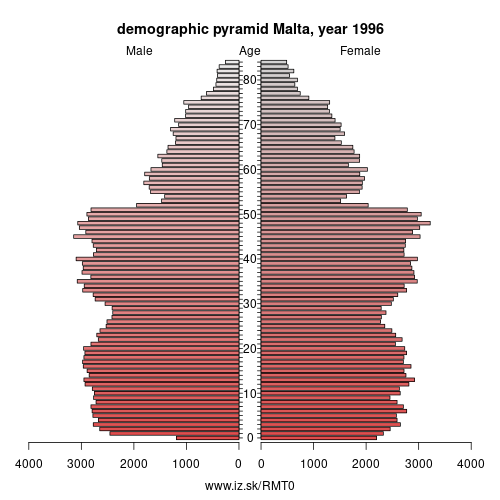
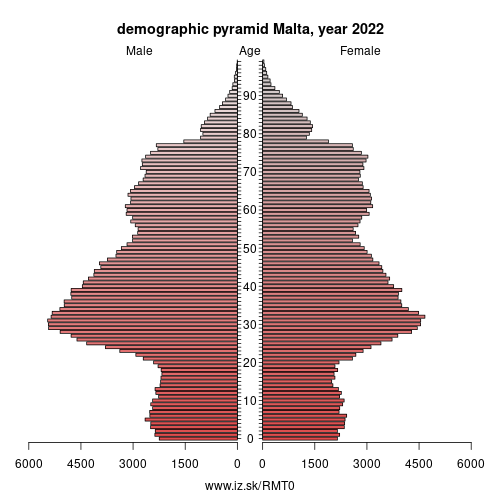
Demographics
| Indicator | Period | Value |
|---|---|---|
| Demographics | ||
| number of inhabitants | 2023 | 542 051 |
| population density | 2022 | 1692.7 |
| old-age dependency ratio | 2023 | 27.1 |
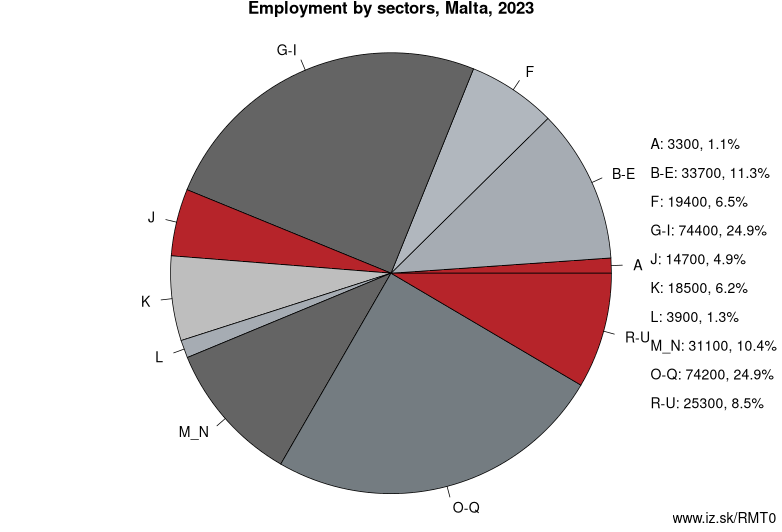
Employment by sectors, Malta
| NACE r2 | % | NACE r2 | % | ||
|---|---|---|---|---|---|
| A | 2.3 | 1 % | B-E | 31.5 | 11 % |
| F | 18.4 | 6 % | G-I | 68.7 | 24 % |
| J | 12.7 | 4 % | K | 17.6 | 6 % |
| L | 3.7 | 1 % | M_N | 31.6 | 11 % |
| O-Q | 71.8 | 25 % | R-U | 25.6 | 9 % |
| TOTAL | 284.1 | 100 % |
Data for the period year 2022. Source of the data is Eurostat, table [lfst_r_lfe2en2].
Subregions: Malta, Malta, Gozo and Comino/Għawdex u Kemmuna
Suggested citation: Michal Páleník: Europe and its regions in numbers - Malta – MT0, IZ Bratislava, retrieved from: https://www.iz.sk/PMT0, ISBN: 978-80-970204-9-1, DOI:10.5281/zenodo.10200164
https://www.iz.sk/en/projects/eu-regions/MT0
 Share
Share Facebook
 Twitter
 News
News