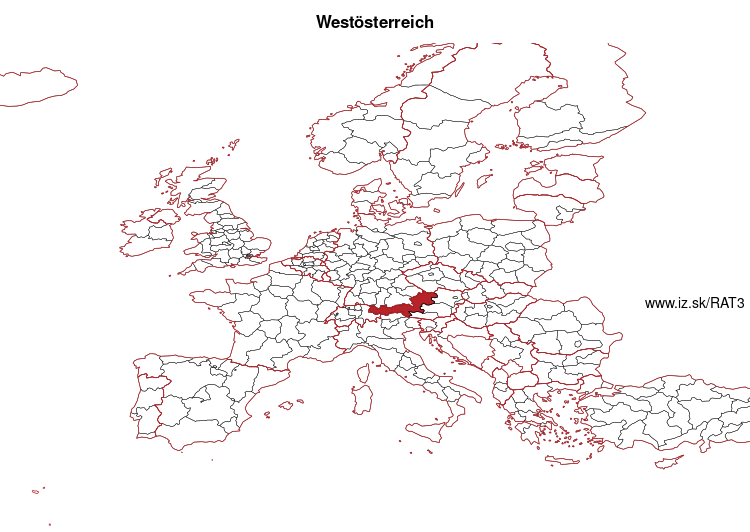
Western Austria – AT3
EU regions: Austria > Western Austria
| Indicator | Period | Value |
|---|---|---|
| Life long learning | ||
| life long learning participation | 2022 | 14.6 |
| Part time jobs and flexible employment | ||
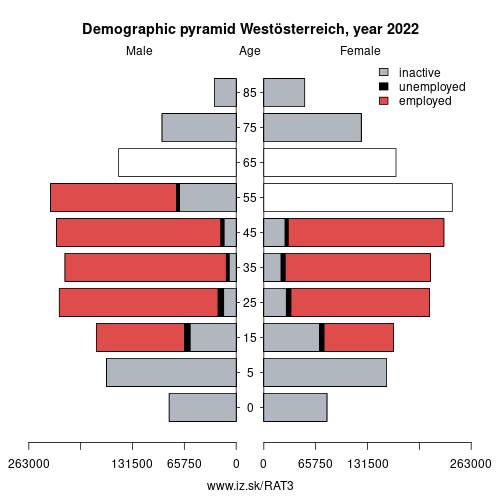
| percentage of part time workers | 2022 | 32.83 |
| percentage of part time workers, men | 2022 | 11.01 |
| percentage of part time workers, women | 2022 | 57.47 |
| Gender differences | ||
| gender gap in employment rate | 2022 | 89.5 |
| gender gap in unemployment rate | 2022 | 100 |
| Graduates and young people | ||
| unemployment rate of youth with elementary education | 2022 | 9.1 |
| NEET | 2022 | 5.8 |
| Gross domestic product | ||
| GDP per capita in PPS of EU average | 2022 | 134 |
| Employment | ||
| employment rate | 2022 | 77.6 |
wikidata Q23241 Western Austria slovensky: AT3
Subregions: Upper Austria, Salzburg, Tyrol, Vorarlberg
Unemployment
| Indicator | Period | Value |
|---|---|---|
| Unemployment | ||
| unemployment rate | 2022 | 3.1 |
| youth unemployment rate | 2022 | 6.5 |
| Long term unemployment | ||
| long term unemployment | 2022 | 0.5 |
| share of long term unemployed | 2022 | 15 |
Demographics
| Indicator | Period | Value |
|---|---|---|
| Demographics | ||
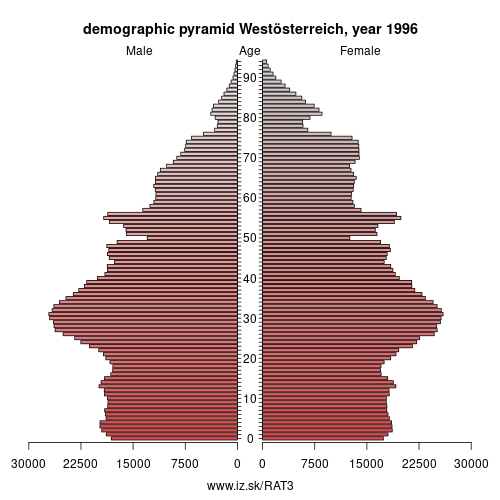
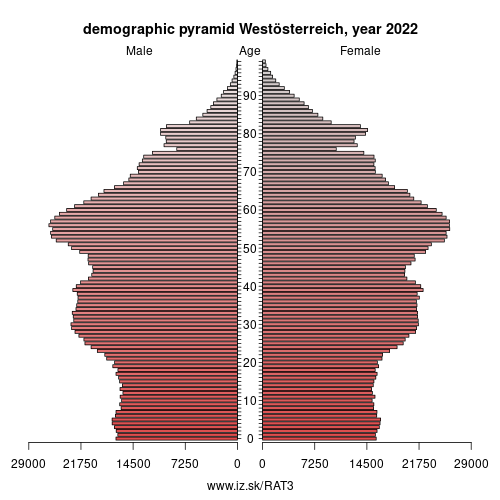
| number of inhabitants | 2023 | 3.26887e+06 |
| population density | 2022 | 96.1 |
| old-age dependency ratio | 2023 | 29.1 |
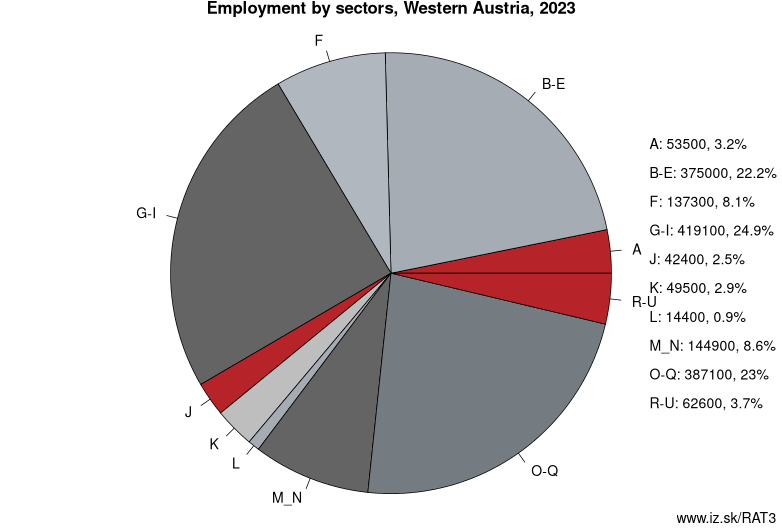
Employment by sectors, Western Austria
| NACE r2 | % | NACE r2 | % | ||
|---|---|---|---|---|---|
| A | 64.9 | 4 % | B-E | 373 | 22 % |
| F | 136.9 | 8 % | G-I | 412.1 | 25 % |
| J | 39.9 | 2 % | K | 44.8 | 3 % |
| L | 10.2 | 1 % | M_N | 145.4 | 9 % |
| O-Q | 381.7 | 23 % | R-U | 64.4 | 4 % |
| TOTAL | 1673.3 | 100 % |
Data for the period year 2022. Source of the data is Eurostat, table [lfst_r_lfe2en2].
Other: Austria, East Austria, Southern Austria, Western Austria
Neighbours: Liechtenstein, Northeast Italy, Baden-Württemberg, Southern Austria, East Austria, Bavaria, Czech Republic, SCHWEIZ/SUISSE/SVIZZERA
Subregions: Upper Austria, Salzburg, Tyrol, Vorarlberg
Suggested citation: Michal Páleník: Europe and its regions in numbers - Western Austria – AT3, IZ Bratislava, retrieved from: https://www.iz.sk/PAT3, ISBN: 978-80-970204-9-1, DOI:10.5281/zenodo.10200164
https://www.iz.sk/en/projects/eu-regions/AT3
 Share
Share Facebook
 Twitter
 News
News