Tyrol – AT33
EU regions: Austria > Western Austria > Tyrol
| Indicator | Period | Value |
|---|---|---|
| Life long learning | ||
| life long learning participation | 2022 | 16.6 |
| Part time jobs and flexible employment | ||
| percentage of part time workers | 2022 | 33.47 |
| percentage of part time workers, men | 2022 | 13.06 |
| percentage of part time workers, women | 2022 | 56.41 |
| Gender differences | ||
| gender gap in employment rate | 2022 | 88.61 |
| gender gap in unemployment rate | 2022 | 106.45 |
| Graduates and young people | ||
| NEET | 2022 | 5.5 |
| Gross domestic product | ||
| GDP per capita in PPS of EU average | 2022 | 129 |
| Employment | ||
| employment rate | 2022 | 77.8 |
| Social exclusion | ||
| people at risk of poverty or social exclusion | 2018 | 16.3 |
More on wikipedia wikidata Q42880 on OpenStreetMap Tyrol slovensky: AT33
Subregions: Reutte district, Innsbruck, Lienz District, Tyrolean Oberland, Tyrolean Unterland
Unemployment
| Indicator | Period | Value |
|---|---|---|
| Unemployment | ||
| unemployment rate | 2022 | 3.2 |
| youth unemployment rate | 2022 | 7.4 |
| Long term unemployment | ||
| long term unemployment | 2016 | 0.8 |
| share of long term unemployed | 2016 | 21.7 |
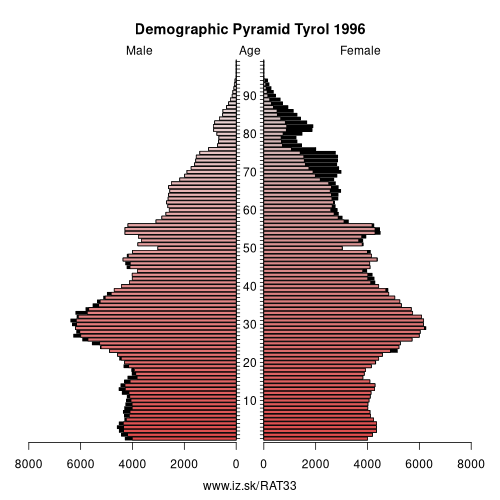
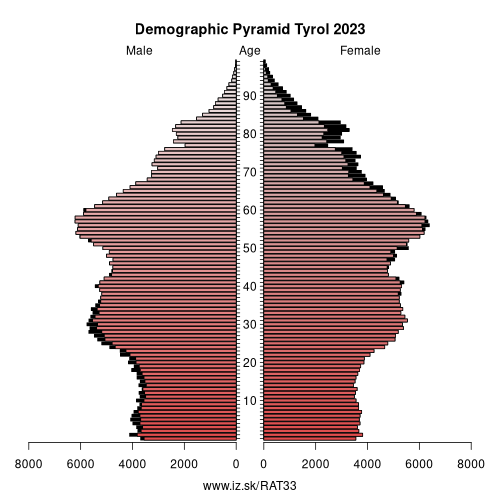
Demographics
| Indicator | Period | Value |
|---|---|---|
| Demographics | ||
| number of inhabitants | 2023 | 771 304 |
| population density | 2022 | 61.4 |
| old-age dependency ratio | 2023 | 28.5 |
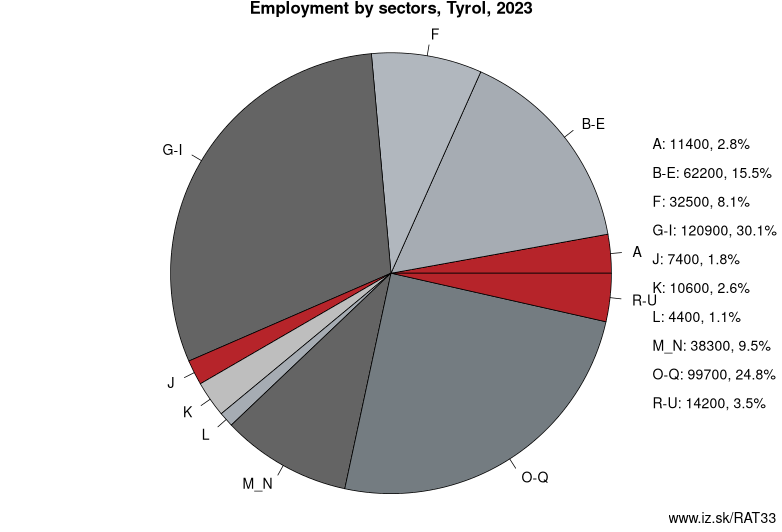
Employment by sectors, Tyrol
| NACE r2 | % | NACE r2 | % | ||
|---|---|---|---|---|---|
| A | 11.3 | 3 % | B-E | 60.5 | 15 % |
| F | 33 | 8 % | G-I | 120.6 | 30 % |
| J | 8.9 | 2 % | K | 9.3 | 2 % |
| L | 3.5 | 1 % | M_N | 37.1 | 9 % |
| O-Q | 101.9 | 26 % | R-U | 12 | 3 % |
| TOTAL | 398.2 | 100 % |
Data for the period year 2022. Source of the data is Eurostat, table [lfst_r_lfe2en2].
Other: Western Austria, Tyrol, Upper Austria, Salzburg, Vorarlberg
Neighbours: Carinthia, Upper Bavaria, Veneto, Salzburg, Swabia, Eastern Switzerland, Vorarlberg, South Tyrol
Subregions: Reutte district, Innsbruck, Lienz District, Tyrolean Oberland, Tyrolean Unterland
Suggested citation: Michal Páleník: Europe and its regions in numbers - Tyrol – AT33, IZ Bratislava, retrieved from: https://www.iz.sk/PAT33, ISBN: 978-80-970204-9-1, DOI:10.5281/zenodo.10200164
 Share
Share Facebook
 Twitter
 News
News