Latvia – LV0
| Indicator | Period | Value |
|---|---|---|
| Life long learning | ||
| life long learning participation | 2025 | 11.4 |
| Part time jobs and flexible employment | ||
| percentage of part time workers | 2025 | 8.51 |
| percentage of part time workers, men | 2025 | 5.42 |
| percentage of part time workers, women | 2025 | 11.48 |
| Gender differences | ||
| gender gap in employment rate | 2025 | 97.94 |
| gender gap in unemployment rate | 2025 | 79.22 |
| Graduates and young people | ||
| unemployment rate of youth with elementary education | 2025 | 22.5 |
| NEET | 2025 | 9.1 |
| Gross domestic product | ||
| GDP per capita in PPS of EU average | 2024 | 68 |
| Employment | ||
| employment rate | 2025 | 71.9 |
Latvia slovensky: LV0
Subregions: Latvia, Kurzeme Region, Latgale Region, Riga, Pierīga statistical region, Vidzeme Region, Zemgale Region
Unemployment
| Indicator | Period | Value |
|---|---|---|
| Unemployment | ||
| unemployment rate | 2025 | 7.3 |
| youth unemployment rate | 2025 | 14.8 |
| Long term unemployment | ||
| long term unemployment | 2025 | 2.3 |
| share of long term unemployed | 2025 | 33.7 |
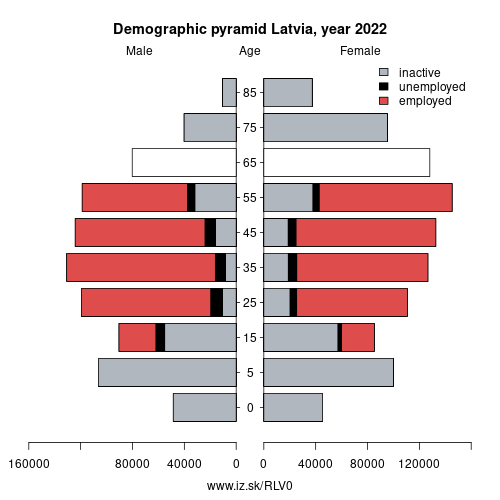
Demographics

| Indicator | Period | Value |
|---|---|---|
| Demographics | ||
| number of inhabitants | 2025 | 1 860 565 |
| population density | 2024 | 30 |
| old-age dependency ratio | 2025 | 34.7 |
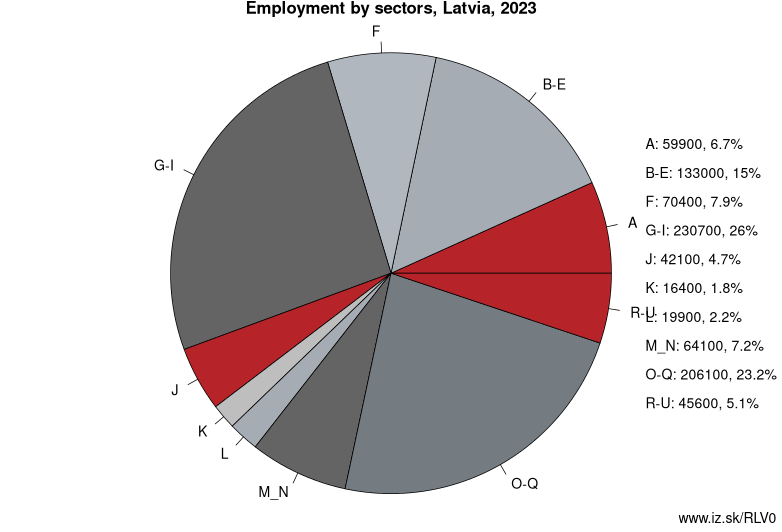
Employment by sectors, Latvia
| NACE r2 | % | NACE r2 | % | ||
|---|---|---|---|---|---|
| A | 60.4 | 7% | B-E | 129.9 | 15% |
| F | 62.4 | 7% | G-I | 220.6 | 25% |
| J | 40.7 | 5% | K | 18.7 | 2% |
| L | 18.5 | 2% | M_N | 67.4 | 8% |
| NRP | 3.4 | 0% | O-Q | 216 | 24% |
| R-U | 51.5 | 6% | TOTAL | 889.7 | 100% |
Data for the period year 2025. Source of the data is Eurostat, table [lfst_r_lfe2en2].
Neighbours: Lithuania, Estonia
Subregions: Latvia, Kurzeme Region, Latgale Region, Riga, Pierīga statistical region, Vidzeme Region, Zemgale Region
Suggested citation: Michal Páleník: Europe and its regions in numbers - Latvia – LV0, IZ Bratislava, retrieved from: https://www.iz.sk/PLV0, ISBN: 978-80-970204-9-1, DOI:10.5281/zenodo.10200164
https://www.iz.sk/en/projects/eu-regions/LV0
 Share
Share Facebook
 Twitter
 News
News