Latvia – LV
More on wikipedia wikidata Q211 on OpenStreetMap Latvia slovensky: LV
Unemployment
| Indicator | Period | Value |
|---|---|---|
| Unemployment | ||
| unemployment rate | 2022 | 7.1 |
| youth unemployment rate | 2023q4 | 13.7 |
| unemployment rate of low educated people | 2023q4 | 13.8 |
| Long term unemployment | ||
| long term unemployment | 2023q4 | 1.9 |
| share of long term unemployed | 2022 | 28.9 |
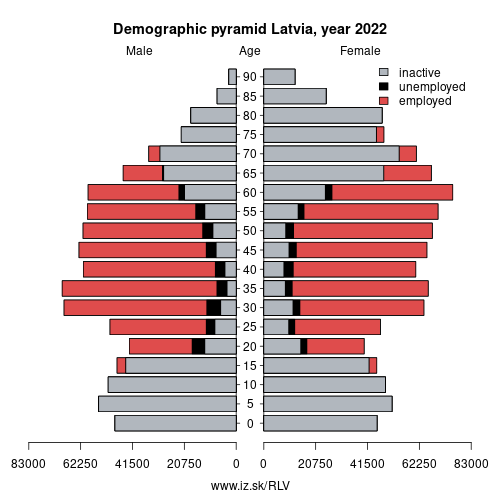
Composition of population according to age group, education and economic activity, Latvia
| Age group | Low education | Middle education | High education |
|---|---|---|---|
| Y20-29 | P: 16.9 E: 8.2; U: 2.1; I: 6.6 | P: 104.4 E: 66.7; U: 8.9; I: 28.8 | P: 54.6 E: 45.9; U: 2.6; I: 6.1 |
| Y30-39 | P: 25.1 E: 16.6; U: 2.2; I: 6.3 | P: 116.5 E: 94.9; U: 8.0; I: 13.6 | P: 126.4 E: 111.4; U: 5.1; I: 9.9 |
| Y40-49 | P: 29.3 E: 19.5; U: 2.8; I: 7.0 | P: 117.5 E: 92.7; U: 9.1; I: 15.7 | P: 102.4 E: 92.8; U: 2.8; I: 6.8 |
| Y50-59 | P: 12.5 E: 6.2; U: 1.5; I: 4.8 | P: 158.9 E: 120.5; U: 8.1; I: 30.3 | P: 83.8 E: 73.5; U: 3.5; I: 6.8 |
| Y60-69 | P: 13.8 E: 2.9; U: 0.3; I: 10.6 | P: 162.6 E: 75.7; U: 3.6; I: 83.3 | P: 70.1 E: 39.6; U: 1.9; I: 28.6 |
Note: in thousands in 2022, according to labour force sample survey. P – total population, E – employed, U – unemployed, I – number of ecnomically inactive
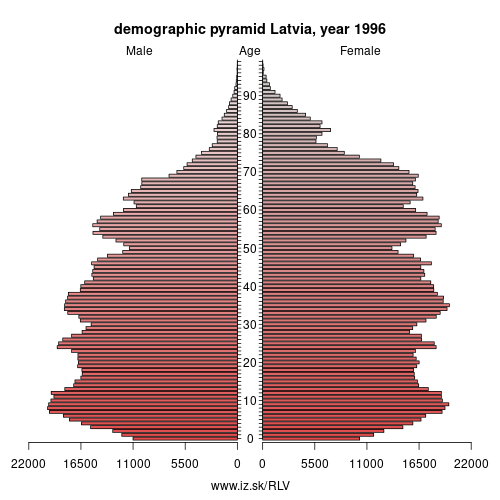
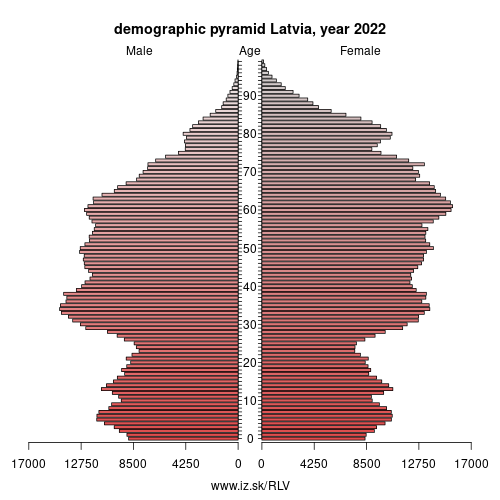
Demographics
| Indicator | Period | Value |
|---|---|---|
| Demographics | ||
| number of inhabitants | 2023 | 1.883008e+06 |
| population density | 2022 | 29.7 |
| old-age dependency ratio | 2023 | 33.3 |
| Population ageing | ||
| unemployment rate – over 55 years | 2023q4 | 8 |
| aggregate replacement ratio | 2023 | 0.5 |
| aggregate replacement ratio – females | 2023 | 0.53 |
| life expectancy of a 50 year old | 2021 | 26.4 |
| healty life expectancy at 50 years | 2021 | 11.8 |
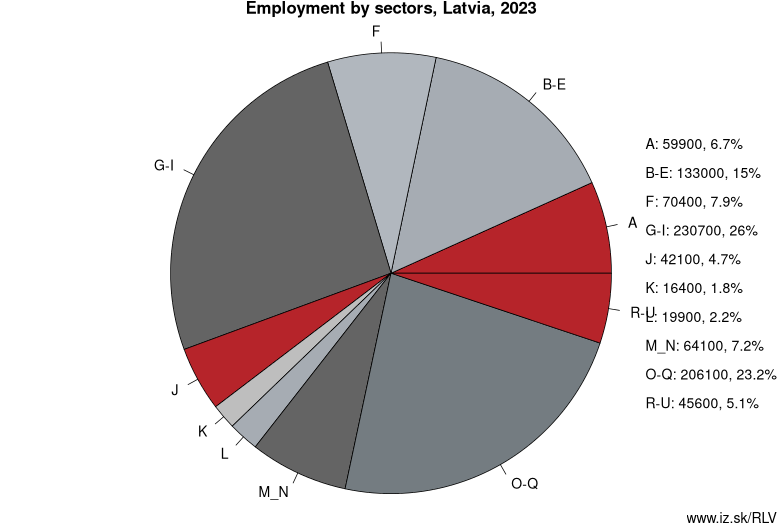
Employment by sectors, Latvia
| NACE r2 | % | NACE r2 | % | ||
|---|---|---|---|---|---|
| A | 60.3 | 7 % | B-E | 138.1 | 15 % |
| F | 72.2 | 8 % | G-I | 233 | 26 % |
| J | 42.9 | 5 % | K | 16.9 | 2 % |
| L | 16.9 | 2 % | M_N | 61.3 | 7 % |
| O-Q | 206.6 | 23 % | R-U | 41.5 | 5 % |
| TOTAL | 891.2 | 100 % |
Data for the period year 2022. Source of the data is Eurostat, table [lfst_r_lfe2en2].
Latvia ( or (listen); Latvian: Latvija [ˈlatvija], Livonian: Lețmō), officially the Republic of Latvia (Latvian: Latvijas Republika, Livonian: Lețmō Vabāmō), is a country in the Baltic region of Northern Europe. Since its independence, Latvia has been referred to as one of the Baltic states. It is bordered by Estonia to the north, Lithuania to the south, Russia to the east, and Belarus to the southeast, and shares a maritime border with Sweden to the west. Latvia has 1,957,200 inhabitants and a territory of 64,589 km2 (24,938 sq mi). The country has a temperate seasonal climate.
After centuries of Swedish, Polish and Russian rule, a rule mainly executed by the Baltic German aristocracy, the Republic of Latvia was established on 18 November 1918 when it broke away and declared independence in the aftermath of World War I. However, by the 1930s the country became increasingly autocratic after the coup in 1934 establishing an authoritarian regime under Kārlis Ulmanis. The country's de facto independence was interrupted at the outset of World War II, beginning with Latvia's forcible incorporation into the Soviet Union, followed by the invasion and occupation by Nazi Germany in 1941, and the re-occupation by the Soviets in 1944 (Courland Pocket in 1945) to form the Latvian SSR for the next 45 years.
The peaceful Singing Revolution, starting in 1987, called for Baltic emancipation from Soviet rule and condemning the Communist regime's illegal takeover. It ended with the Declaration on the Restoration of Independence of the Republic of Latvia on 4 May 1990, and restoring de facto independence on 21 August 1991. Latvia is a democratic sovereign state, parliamentary republic and a very highly developed country according to the United Nations Human Development Index. Its capital Riga served as the European Capital of Culture in 2014.
Other: Lithuania, Latvia, Luxembourg, Liechtenstein
Neighbours: Estonia, Lithuania
Suggested citation: Michal Páleník: Europe and its regions in numbers - Latvia – LV, IZ Bratislava, retrieved from: https://www.iz.sk/PLV, ISBN: 978-80-970204-9-1, DOI:10.5281/zenodo.10200164
 Share
Share Facebook
 Twitter
 News
News