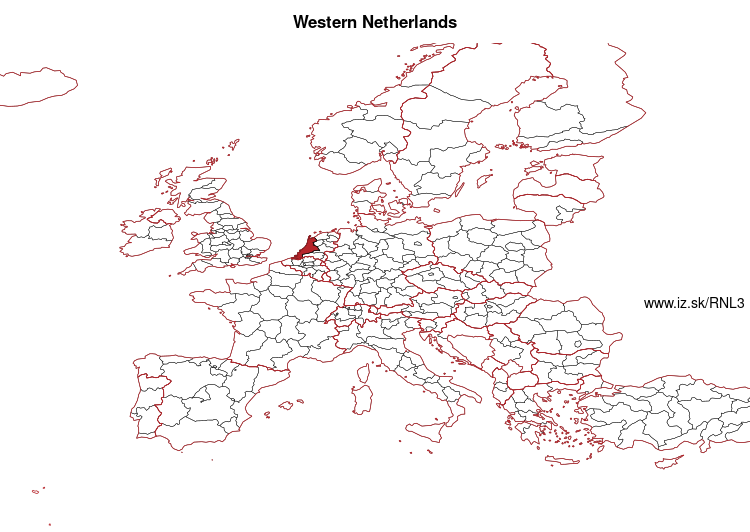
Western Netherlands – NL3
EU regions: Netherlands > Western Netherlands
| Indicator | Period | Value |
|---|---|---|
| Life long learning | ||
| life long learning participation | 2025 | 27 |
| Part time jobs and flexible employment | ||
| percentage of part time workers | 2025 | 35.64 |
| percentage of part time workers, men | 2025 | 17.67 |
| percentage of part time workers, women | 2025 | 55.73 |
| Gender differences | ||
| gender gap in employment rate | 2025 | 92.38 |
| gender gap in unemployment rate | 2025 | 104.88 |
| Graduates and young people | ||
| unemployment rate of youth with elementary education | 2025 | 12.3 |
| NEET | 2025 | 3.7 |
| Gross domestic product | ||
| GDP per capita in PPS of EU average | 2024 | 150 |
| Employment | ||
| employment rate | 2025 | 82 |
| Social exclusion | ||
| people at risk of poverty or social exclusion | 2020 | 17.2 |
Western Netherlands slovensky: NL3
Subregions: Utrecht, North Holland, South Holland, Zeeland
Unemployment
| Indicator | Period | Value |
|---|---|---|
| Unemployment | ||
| unemployment rate | 2025 | 4.2 |
| youth unemployment rate | 2025 | 10 |
| Long term unemployment | ||
| long term unemployment | 2025 | 0.6 |
| share of long term unemployed | 2025 | 13.2 |
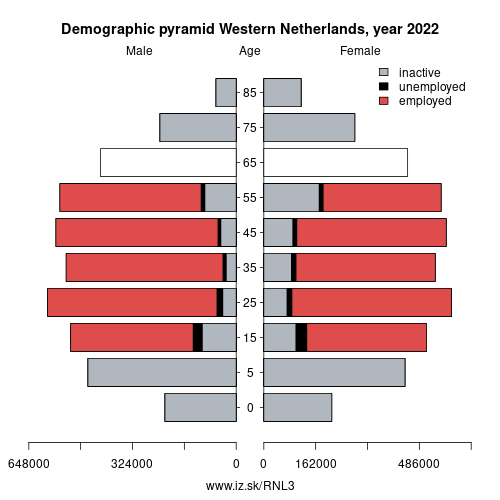
Demographics
| Indicator | Period | Value |
|---|---|---|
| Demographics | ||
| number of inhabitants | 2025 | 8 657 526 |
| population density | 2024 | 979.7 |
| old-age dependency ratio | 2025 | 29.6 |
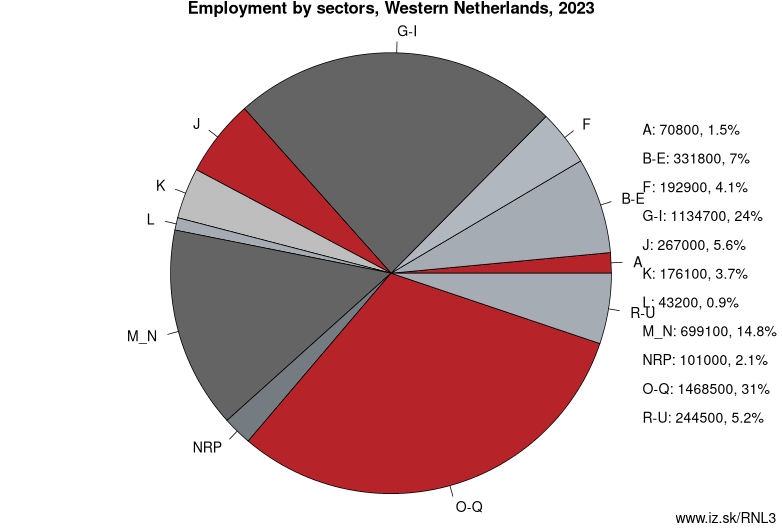
Employment by sectors, Western Netherlands
| NACE r2 | % | NACE r2 | % | ||
|---|---|---|---|---|---|
| A | 61.2 | 1% | B-E | 333.8 | 7% |
| F | 201.7 | 4% | G-I | 1128.4 | 24% |
| J | 258.6 | 5% | K | 156.1 | 3% |
| L | 45.5 | 1% | M_N | 715.2 | 15% |
| NRP | 97.2 | 2% | O-Q | 1546.7 | 32% |
| R-U | 256.4 | 5% | TOTAL | 4800.7 | 100% |
Data for the period year 2025. Source of the data is Eurostat, table [lfst_r_lfe2en2].
Other: Netherlands, Northern Netherlands, Eastern Netherlands, Western Netherlands, Southern Netherlands
Neighbours: Eastern Netherlands, Flemish Region, Northern Netherlands, Southern Netherlands
Subregions: Utrecht, North Holland, South Holland, Zeeland
Suggested citation: Michal Páleník: Europe and its regions in numbers - Western Netherlands – NL3, IZ Bratislava, retrieved from: https://www.iz.sk/PNL3, ISBN: 978-80-970204-9-1, DOI:10.5281/zenodo.10200164
https://www.iz.sk/en/projects/eu-regions/NL3
 Share
Share Facebook
 Twitter
 News
News