Zeeland – NL34
EU regions: Netherlands > Western Netherlands > Zeeland
| Indicator | Period | Value |
|---|---|---|
| Life long learning | ||
| life long learning participation | 2023 | 24.8 |
| Part time jobs and flexible employment | ||
| percentage of part time workers | 2022 | 38 |
| percentage of part time workers, men | 2022 | 14.13 |
| percentage of part time workers, women | 2022 | 66.75 |
| Gender differences | ||
| gender gap in employment rate | 2023 | 87.58 |
| gender gap in unemployment rate | 2023 | 100 |
| Graduates and young people | ||
| unemployment rate of youth with elementary education | 2016 | 10.4 |
| NEET | 2022 | 3.9 |
| Gross domestic product | ||
| GDP per capita in PPS of EU average | 2022 | 111 |
| Employment | ||
| employment rate | 2023 | 83.3 |
| Social exclusion | ||
| people at risk of poverty or social exclusion | 2020 | 14.5 |
More on wikipedia wikidata Q705 on OpenStreetMap Zeeland slovensky: NL34
Subregions: Zeeuwsch-Vlaanderen, Overig Zeeland
Unemployment
| Indicator | Period | Value |
|---|---|---|
| Unemployment | ||
| unemployment rate | 2023 | 2.1 |
| youth unemployment rate | 2023 | 5.1 |
| Long term unemployment | ||
| long term unemployment | 2021 | 0.8 |
| share of long term unemployed | 2021 | 22.6 |
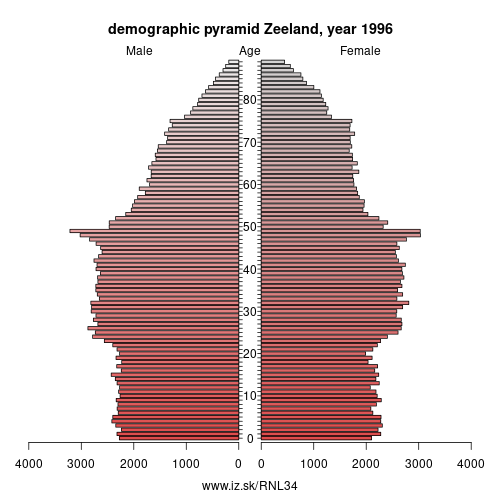
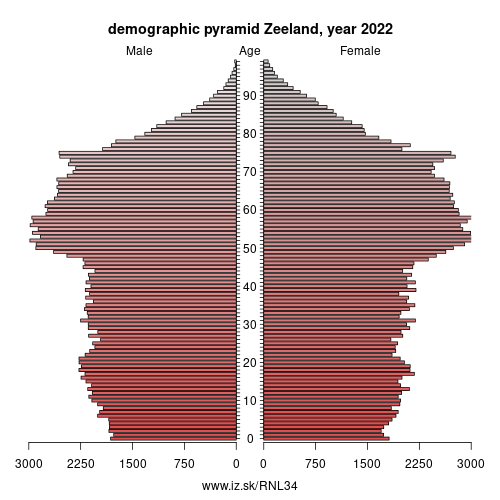
Demographics
| Indicator | Period | Value |
|---|---|---|
| Demographics | ||
| number of inhabitants | 2023 | 391 124 |
| population density | 2022 | 215.7 |
| old-age dependency ratio | 2023 | 40.6 |
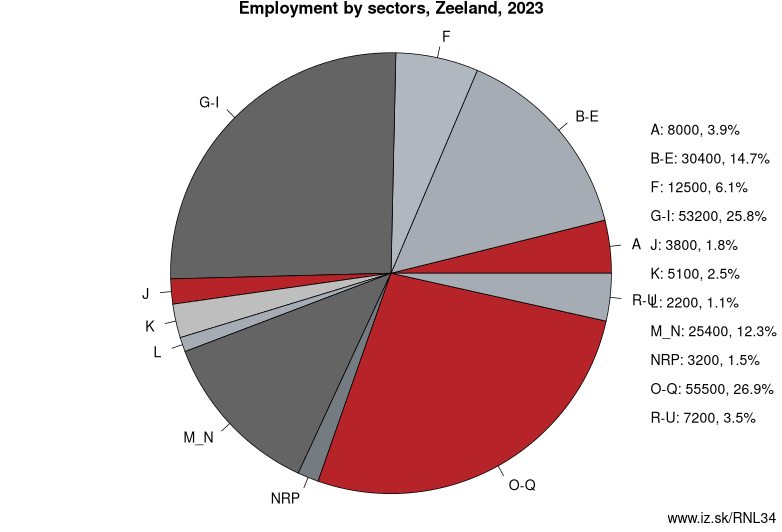
Employment by sectors, Zeeland
| NACE r2 | % | NACE r2 | % | ||
|---|---|---|---|---|---|
| A | 8 | 4 % | B-E | 30.4 | 15 % |
| F | 12.5 | 6 % | G-I | 53.2 | 26 % |
| J | 3.8 | 2 % | K | 5.1 | 2 % |
| L | 2.2 | 1 % | M_N | 25.4 | 12 % |
| NRP | 3.2 | 2 % | O-Q | 55.5 | 27 % |
| R-U | 7.2 | 3 % | TOTAL | 206.6 | 100 % |
Data for the period year 2023. Source of the data is Eurostat, table [lfst_r_lfe2en2].
Zeeland (, Dutch: [ˈzeːlɑnt] (listen); Zeelandic: Zeêland [ˈzɪə̯lɑnt]; historical English exonym Zealand) is the westernmost and least populous province of the Netherlands. The province, located in the south-west of the country, consists of a number of islands and peninsulas (hence its name, meaning „Sealand") and a strip bordering Belgium. Its capital is Middelburg. Its area is about 2,930 square kilometres (1,130 sq mi), of which almost 1,140 square kilometres (440 sq mi) is water, and it has a population of about 380,000.
Large parts of Zeeland are below sea level. The last great flooding of the area was in 1953. Tourism is an important economic activity. In the summer, its beaches make it a popular destination for tourists, especially German tourists. In some areas, the population can be two to four times higher during the high summer season. The coat of arms of Zeeland shows a lion half-emerged from water, and the text luctor et emergo (Latin for „I struggle and emerge").
Other: Western Netherlands, Utrecht, North Holland, South Holland, Zeeland
Neighbours: East Flanders, West Flanders, Province of Antwerp, South Holland, North Brabant
Subregions: Zeeuwsch-Vlaanderen, Overig Zeeland
Suggested citation: Michal Páleník: Europe and its regions in numbers - Zeeland – NL34, IZ Bratislava, retrieved from: https://www.iz.sk/PNL34, ISBN: 978-80-970204-9-1, DOI:10.5281/zenodo.10200164
 Share
Share Facebook
 Twitter
 News
News