Saarland – DEC0
EU regions: Germany > Saarland > Saarland
| Indicator | Period | Value |
|---|---|---|
| Life long learning | ||
| life long learning participation | 2023 | 7.4 |
| Part time jobs and flexible employment | ||
| percentage of part time workers | 2022 | 30.71 |
| percentage of part time workers, men | 2022 | 11.05 |
| percentage of part time workers, women | 2022 | 53.01 |
| Gender differences | ||
| gender gap in employment rate | 2023 | 88.81 |
| gender gap in unemployment rate | 2019 | 75.61 |
| Graduates and young people | ||
| unemployment rate of youth with elementary education | 2009 | 22.2 |
| NEET | 2019 | 5.6 |
| Gross domestic product | ||
| GDP per capita in PPS of EU average | 2022 | 99 |
| Employment | ||
| employment rate | 2023 | 75.1 |
| Social exclusion | ||
| people at risk of poverty or social exclusion | 2019 | 21.6 |
More on wikipedia wikidata Q1201 on OpenStreetMap Saarland slovensky: DEC0
Subregions: Regionalverband Saarbrücken, Merzig-Wadern, Neunkirchen, Saarlouis, Saarpfalz-Kreis, St. Wendel
Unemployment
| Indicator | Period | Value |
|---|---|---|
| Unemployment | ||
| unemployment rate | 2023 | 3.3 |
| youth unemployment rate | 2016 | 10.1 |
| Long term unemployment | ||
| long term unemployment | 2019 | 1.5 |
| share of long term unemployed | 2019 | 41.9 |
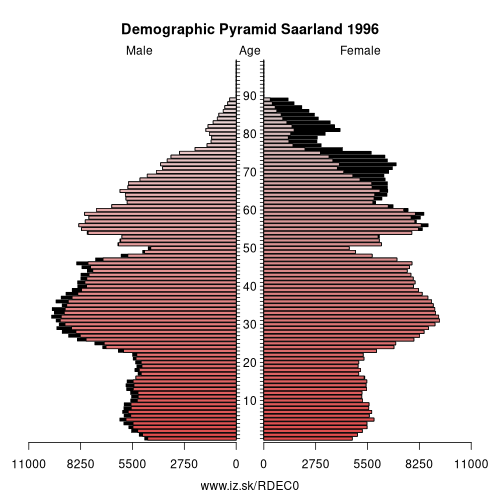
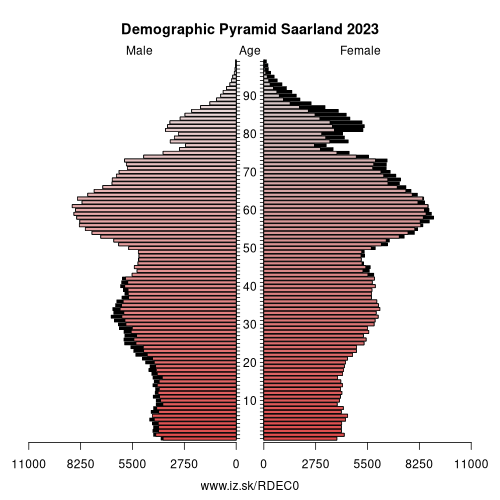
Demographics
| Indicator | Period | Value |
|---|---|---|
| Demographics | ||
| number of inhabitants | 2023 | 992 666 |
| population density | 2022 | 385 |
| old-age dependency ratio | 2023 | 39.7 |
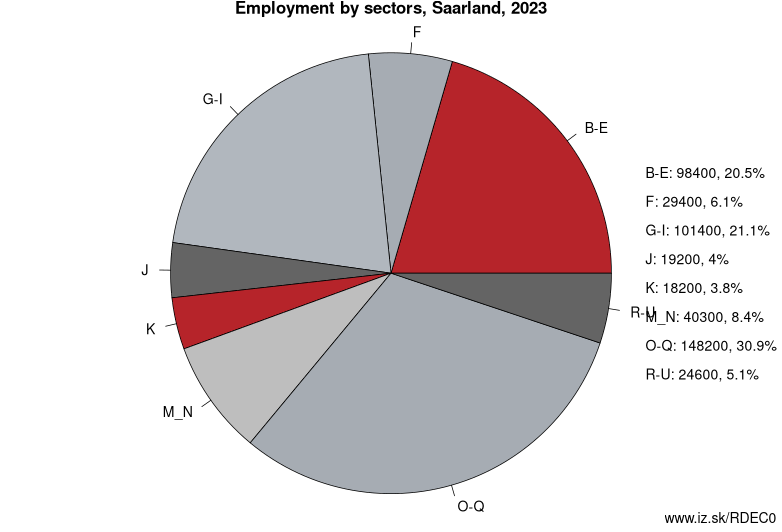
Employment by sectors, Saarland
| NACE r2 | % | NACE r2 | % | ||
|---|---|---|---|---|---|
| B-E | 98.4 | 20 % | F | 29.4 | 6 % |
| G-I | 101.4 | 21 % | J | 19.2 | 4 % |
| K | 18.2 | 4 % | M_N | 40.3 | 8 % |
| O-Q | 148.2 | 31 % | R-U | 24.6 | 5 % |
| TOTAL | 484.3 | 100 % |
Data for the period year 2023. Source of the data is Eurostat, table [lfst_r_lfe2en2].
From Wikipedia: Saarland (, also US: , German: [ˈzaːɐ̯lant] (listen); French: Sarre [saʁ]) is a state of Germany.
Saarland is located in western Germany covering an area of 2,570 km2 (990 sq mi) and a population of 995,600 (2015), the smallest German state in both area and population apart from the city-states of Berlin, Bremen, and Hamburg. Saarbrücken is the state capital and largest city, while other major cities include Neunkirchen and Saarlouis. Saarland is surrounded by France to the west (apart from a few kms. of the Moselle river bordering Luxembourg) and south and the German state of Rhineland-Palatinate to the north and east.
Saarland was established in 1920 after World War I as the Territory of the Saar Basin, formed from land of Prussia and Bavaria occupied and governed by France and the United Kingdom under a League of Nations mandate. The heavily industrialized region was economically valuable due to the wealth of its coal deposits and location on the border between France and Germany. Saarland was returned to Nazi Germany in the 1935 Saar status referendum, becoming de jure part of Bavaria and de facto part of Gau Westmark. Following World War II, the French military administration in Allied-occupied Germany organized the territory as the Saar Protectorate from 1947, becoming a protectorate of France, and between 1950 and 1956 was a member of the Council of Europe. Saarland rejected the 1955 Saar Statute referendum, and joined the Federal Republic of Germany as a state on 1 January 1957.
Neighbours: Luxembourg, Lorraine, Rheinhessen-Pfalz, Koblenz Government Region, Trier Government Region
Subregions: Regionalverband Saarbrücken, Merzig-Wadern, Neunkirchen, Saarlouis, Saarpfalz-Kreis, St. Wendel
Suggested citation: Michal Páleník: Europe and its regions in numbers - Saarland – DEC0, IZ Bratislava, retrieved from: https://www.iz.sk/PDEC0, ISBN: 978-80-970204-9-1, DOI:10.5281/zenodo.10200164
 Share
Share Facebook
 Twitter
 News
News