Northern Ireland – UKN0
EU regions: United Kingdom > Northern Ireland > Northern Ireland
| Indicator | Period | Value |
|---|---|---|
| Life long learning | ||
| life long learning participation | 2019 | 10.9 |
| Part time jobs and flexible employment | ||
| percentage of part time workers | 2019 | 21.88 |
| percentage of part time workers, men | 2019 | 8.97 |
| percentage of part time workers, women | 2019 | 36.12 |
| Gender differences | ||
| gender gap in employment rate | 2019 | 90.34 |
| gender gap in unemployment rate | 2019 | 82.76 |
| Graduates and young people | ||
| unemployment rate of youth with elementary education | 2016 | 30.3 |
| NEET | 2019 | 9.7 |
| Employment | ||
| employment rate | 2019 | 70.9 |
Northern Ireland slovensky: UKN0
Subregions: Belfast, Armagh City, Banbridge and Craigavon, Newry, Mourne and Down, Ards and North Down
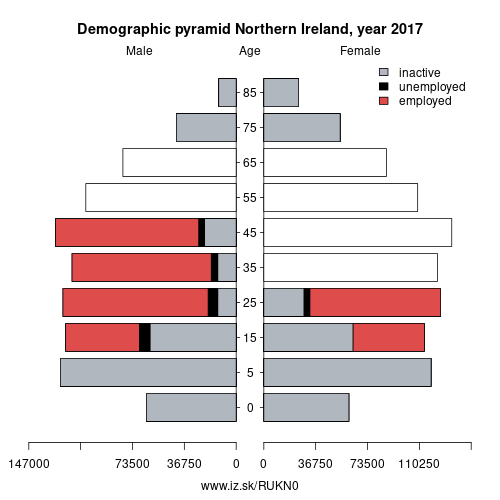
Unemployment
| Indicator | Period | Value |
|---|---|---|
| Unemployment | ||
| unemployment rate | 2019 | 2.7 |
| youth unemployment rate | 2019 | 7 |
| Long term unemployment | ||
| long term unemployment | 2019 | 1.1 |
| share of long term unemployed | 2019 | 39.7 |
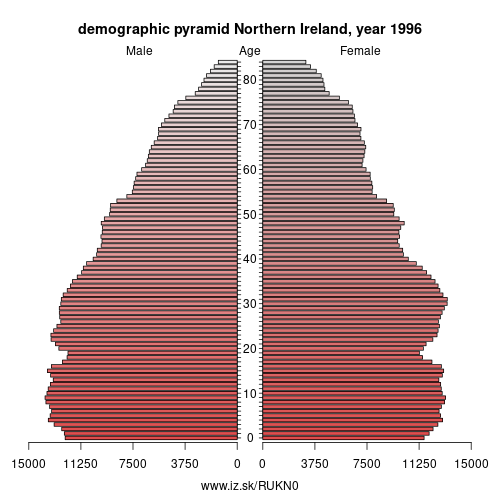
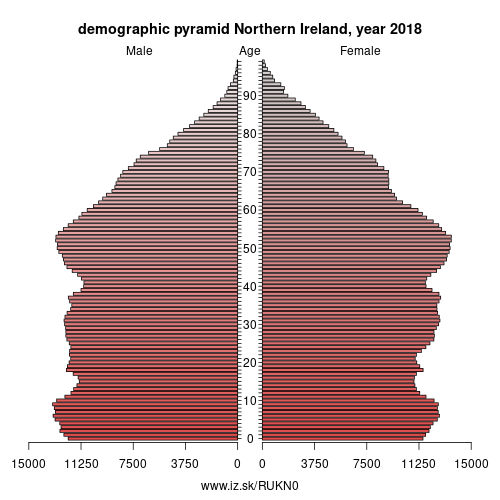
Demographics
| Indicator | Period | Value |
|---|---|---|
| Demographics | ||
| number of inhabitants | 2018 | 1.875957e+06 |
| population density | 2018 | 138.7 |
| old-age dependency ratio | 2019 | 26 |
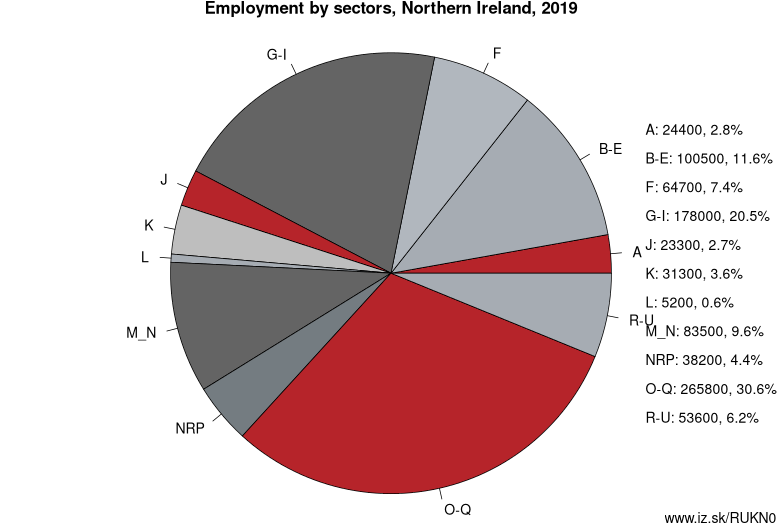
Employment by sectors, Northern Ireland
| NACE r2 | % | NACE r2 | % | ||
|---|---|---|---|---|---|
| A | 24.4 | 3 % | B-E | 100.5 | 12 % |
| F | 64.7 | 7 % | G-I | 178 | 20 % |
| J | 23.3 | 3 % | K | 31.3 | 4 % |
| L | 5.2 | 1 % | M_N | 83.5 | 10 % |
| NRP | 38.2 | 4 % | O-Q | 265.8 | 31 % |
| R-U | 53.6 | 6 % | TOTAL | 868.6 | 100 % |
Data for the period year 2019. Source of the data is Eurostat, table [lfst_r_lfe2en2].
Other: Northern Ireland, Northern Ireland
Neighbours: Eastern & Midland Region, Northern & Western Region
Subregions: Belfast, Armagh City, Banbridge and Craigavon, Newry, Mourne and Down, Ards and North Down
Suggested citation: Michal Páleník: Europe and its regions in numbers - Northern Ireland – UKN0, IZ Bratislava, retrieved from: https://www.iz.sk/PUKN0, ISBN: 978-80-970204-9-1, DOI:10.5281/zenodo.10200164
https://www.iz.sk/en/projects/eu-regions/UKN0
 Share
Share Facebook
 Twitter
 News
News