Province of Namur – BE35
EU regions: Belgium > Wallonia > Province of Namur
| Indicator | Period | Value |
|---|---|---|
| Life long learning | ||
| life long learning participation | 2025 | 17.7 |
| Part time jobs and flexible employment | ||
| percentage of part time workers | 2025 | 25.47 |
| percentage of part time workers, men | 2025 | 13.06 |
| percentage of part time workers, women | 2025 | 38.18 |
| Gender differences | ||
| gender gap in employment rate | 2025 | 98.78 |
| gender gap in unemployment rate | 2025 | 79.07 |
| Graduates and young people | ||
| unemployment rate of youth with elementary education | 2025 | 49.8 |
| NEET | 2025 | 10 |
| Gross domestic product | ||
| GDP per capita in PPS of EU average | 2024 | 80 |
| Employment | ||
| employment rate | 2025 | 65.1 |
Province of Namur slovensky: BE35
Subregions: Arrondissement of Dinant, Arrondissement of Namur, Arrondissement of Philippeville
Unemployment
| Indicator | Period | Value |
|---|---|---|
| Unemployment | ||
| unemployment rate | 2025 | 7.8 |
| youth unemployment rate | 2025 | 24.7 |
| Long term unemployment | ||
| long term unemployment | 2025 | 3.5 |
| share of long term unemployed | 2025 | 44.8 |
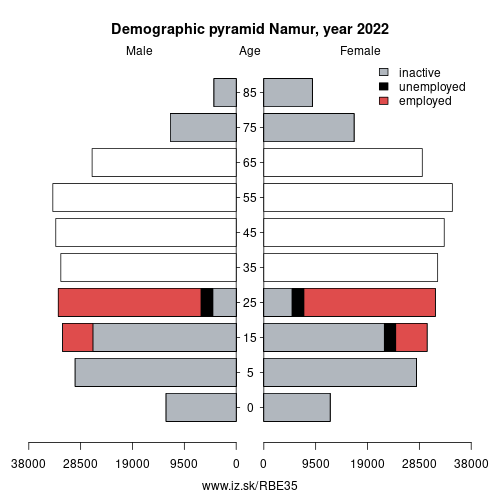
Demographics

| Indicator | Period | Value |
|---|---|---|
| Demographics | ||
| number of inhabitants | 2025 | 509 771 |
| population density | 2024 | 138.9 |
| old-age dependency ratio | 2025 | 31.7 |
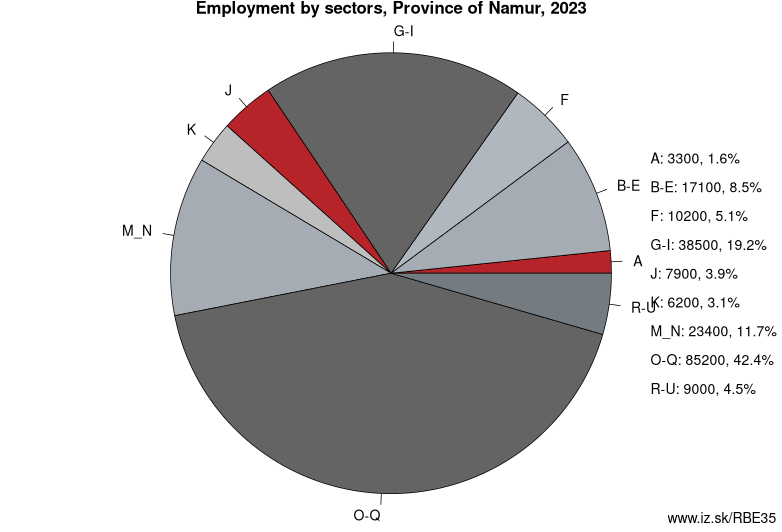
Employment by sectors, Province of Namur
| NACE r2 | % | NACE r2 | % | ||
|---|---|---|---|---|---|
| A | 2.6 | 1% | B-E | 22.7 | 11% |
| F | 14.8 | 7% | G-I | 39.5 | 19% |
| J | 4.8 | 2% | K | 6.6 | 3% |
| M_N | 23.2 | 11% | O-Q | 87.3 | 41% |
| R-U | 9.9 | 5% | TOTAL | 212.6 | 100% |
Data for the period year 2025. Source of the data is Eurostat, table [lfst_r_lfe2en2].
Other: Wallonia, Walloon Brabant, Province of Liege, Province of Namur, Luxembourg, Hainaut
Neighbours: Champagne-Ardenne, Walloon Brabant, Luxembourg, Province of Liege, Hainaut
Subregions: Arrondissement of Dinant, Arrondissement of Namur, Arrondissement of Philippeville
Suggested citation: Michal Páleník: Europe and its regions in numbers - Province of Namur – BE35, IZ Bratislava, retrieved from: https://www.iz.sk/PBE35, ISBN: 978-80-970204-9-1, DOI:10.5281/zenodo.10200164
https://www.iz.sk/en/projects/eu-regions/BE35
 Share
Share Facebook
 Twitter
 News
News